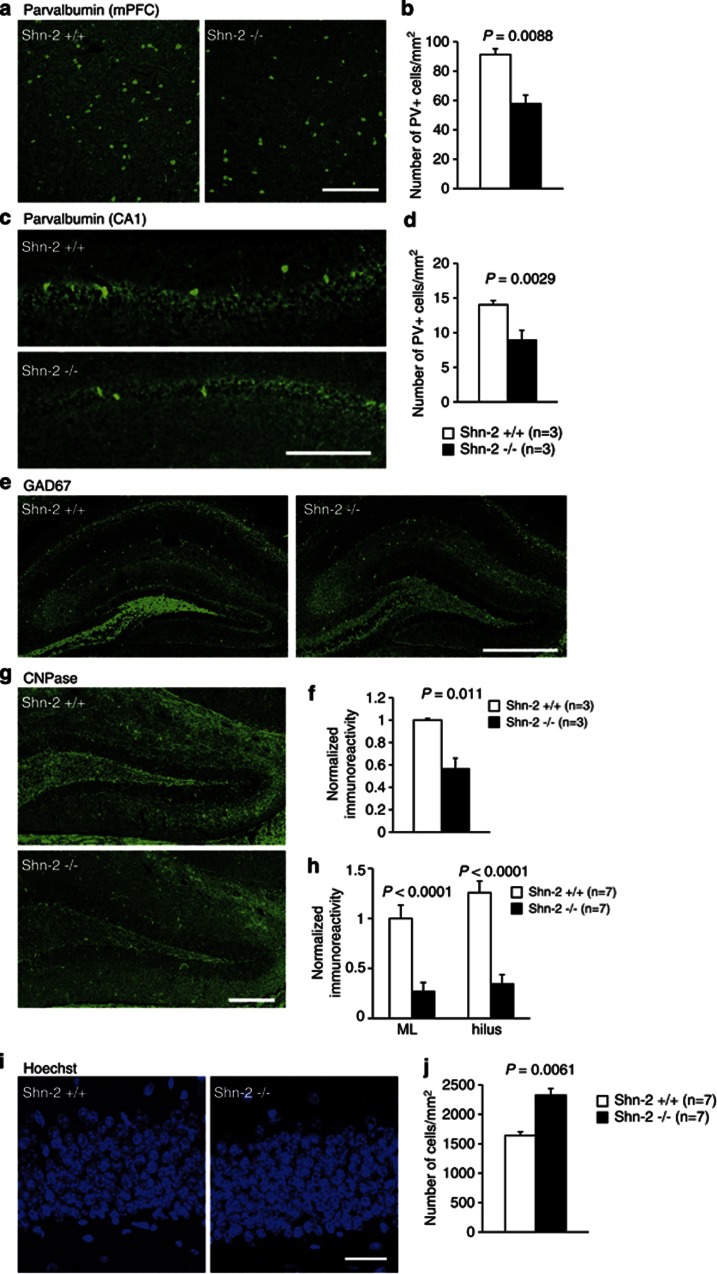
Figure 3.
Schizophrenia-related alterations in the Shn-2 KO mouse brain. (a–d) The number of parvalbumin-positive cells is decreased in mPFC (P=0.0088) (a, b) and CA1 (P=0.0029) (c, d) of Shn-2 KO mice. (e, f) The expression of GAD67 in MFs of the hippocampus decreased in mutants (P=0.011). (g, h) Reduced CNPase expression in the DG of Shn-2 KO mice compared with controls (molecular layer, P<0.0001; hilus, P<0.0001). (i, j) DG cell number was evaluated by staining cell nuclei with Hoechst dye. Cell-packing density was higher in Shn-2 KO mice (P=0.0061) (j). GAD67, glutamic acid decarboxylase 67; CNPase, 2′,3-cyclic nucleotide 3′-phosphodiesterase; ML, molecular layer. Scale bars indicate 200 μm (a, c, g), 500 μm (e), 20 μm (i).

