Figure 7.
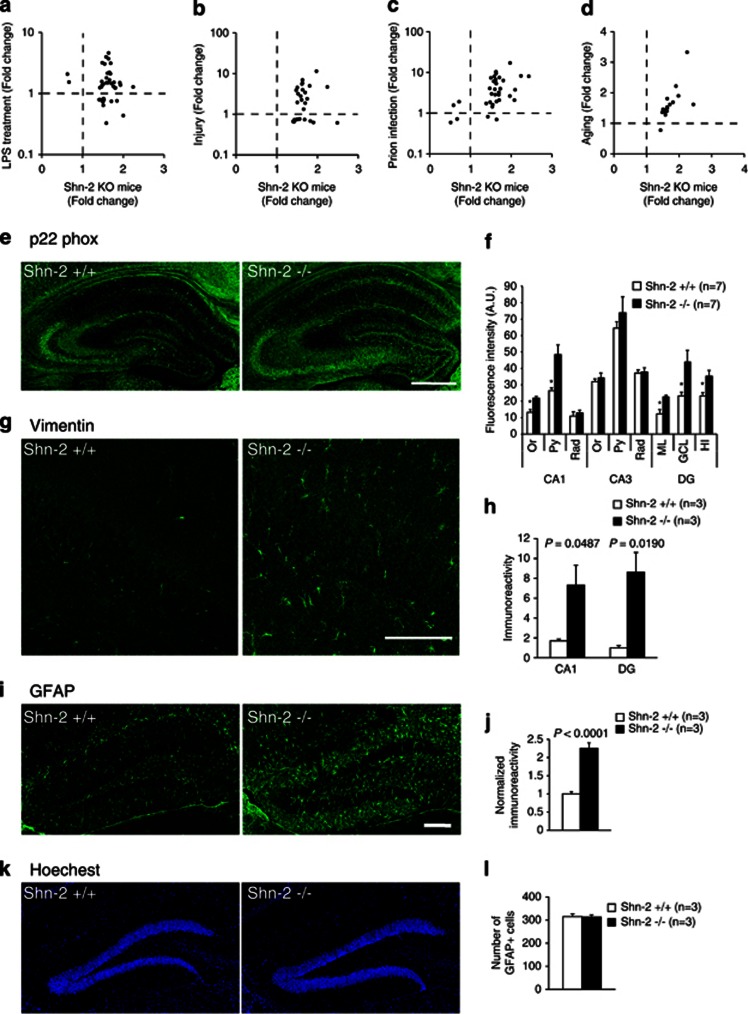
Inflammatory-like phenomena in the hippocampus of Shn-2 KO mice. (a–d) The hippocampal transcriptome pattern of Shn-2 KO mice was similar to the transcriptome data from LPS treatment (a), injury (b), prion infection (c), and aging (d). The Gene Expression Omnibus (GEO) accession numbers for the transcriptome data used for the graphs are GSE23182 (a, c), GSE5296 (b), and GSE13799 (d). Genes that showed differential expression between conditions at P<0.005 in Shn-2 KO mice and P<0.025 in LPS treatment were plotted in (a). Genes that showed differential expression between conditions at P<0.005 in both transcriptome data sets are plotted in (b–d). (e, f) The expression of p22 phox, a component of NADH/NADPH oxidase, was increased in the DG (ML, P=0.027; GCL, P=0.048; HI, P=0.039) and CA1 (Or, P=0.011; Py, P=0.019) of Shn-2 KO mice. (g, h) The expression of vimentin in the DG of mutants was higher than that of the controls. (i–k) The expression of GFAP was increased in the DG of Shn-2 KO mice. Although the area of GFAP-positive cells increased (j), the number of GFAP-positive cells remained unchanged (k, l), which was confirmed by Hoechest nuclear counterstaining. Or, oriens layer; Py, pyramidal cell layer; Rad, stratum radiatum; ML, molecular layer; GCL, granule cell layer; HI, hilus. Scale bars indicate 500 μm (e), 100 μm (g), and 200 μm (i).

