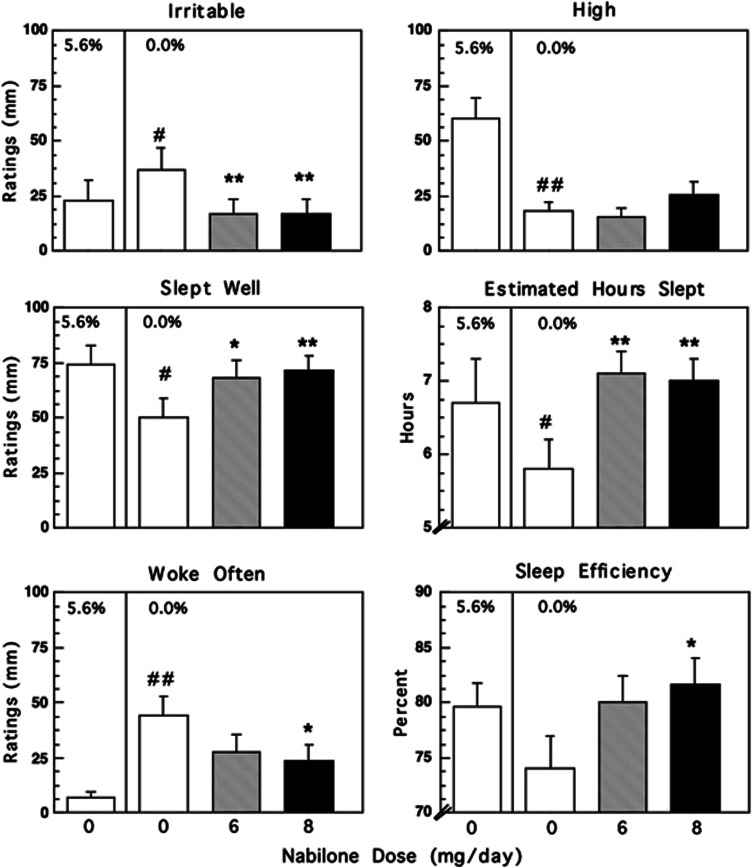
Figure 2.
Mean effects on mood and sleep measures during marijuana administration (5.6%) and during marijuana abstinence as a function of nabilone dose. Maximum score for ratings=100 mm. Each graph represents data collected in 11 participants except for sleep efficiciency; because of equipment malfunction, this analysis included 10 rather than 11 participants. Asterisks indicate a significant difference between each nabilone dose and placebo medication (*p<0.05; **p<0.01). Number signs indicate a significant difference during marijuana administration and during marijuana abstinence under placebo medication conditions (#p<0.05; ##p<0.01). Error bars represent ± SEM.

