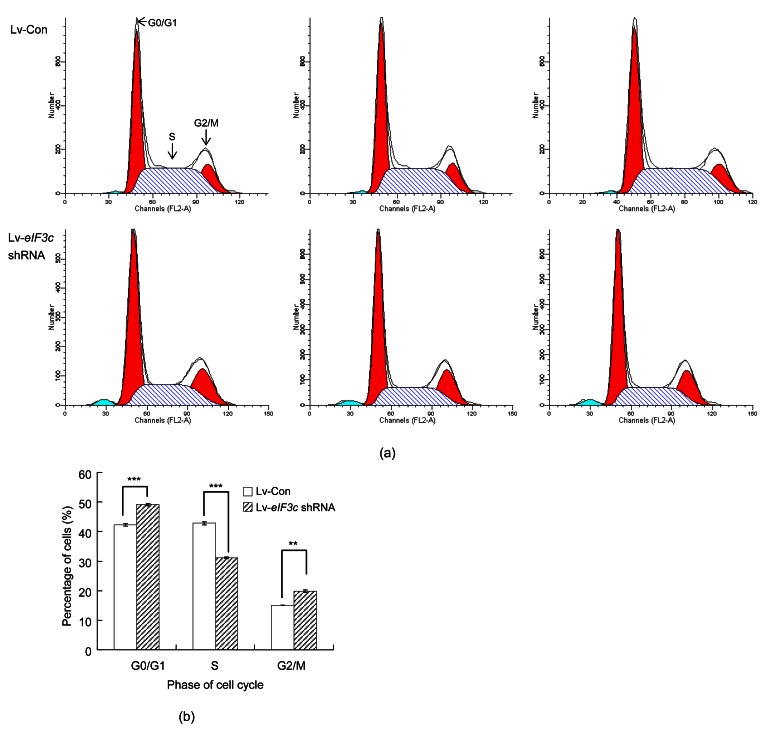
Fig. 4.
Effect of eIF3c knockdown on the cell cycle distribution of RKO cells
(a) The histograms obtained from flow cytometric analysis of eIF3c deleted and non-deleted cells from three independent trials; (b) Percentages of RKO cells at different phases of the cell cycle following eIF3c siRNA or control siRNA infection. *** P<0.001, ** P<0.01 in comparison to the control

