FIGURE 6.
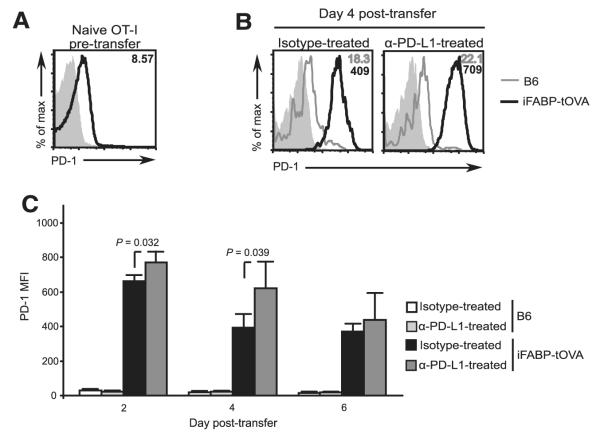
PD-L1 blockade can affect self-reactive CD8+ T cell function early upon Ag encounter in iFABP-tOVA mice. A, Surface anti-PD-1 staining on naive OT-I T cells gated on CD8+Vα2+ CD45.1+ cells (open histogram) before transfer compared with isotype control (gray-filled histogram). Value in histogram indicates mean fluorescence intensity (MFI) for PD-1. B, Overlays depict PD-1 expression by OT-I T cells isolated from lymph nodes 4 days after adoptive transfer into isotype and anti-PD-L1-treated C57BL/6 (gray line histogram) and iFABP-tOVA (open histogram) mice compared with isotype control (gray-filled histogram). Values in histograms indicate mean fluorescence intensity for PD-1. C, Surface PD-1 expression over time on OT-I T cells isolated from lymph nodes of isotype and anti-PD-L1-treated C57BL/6 and iFABP-tOVA mice. Data represent the mean fluorescence intensity ± SD for PD-1 expression on OT-I T cells (n = 3 mice for each condition).

