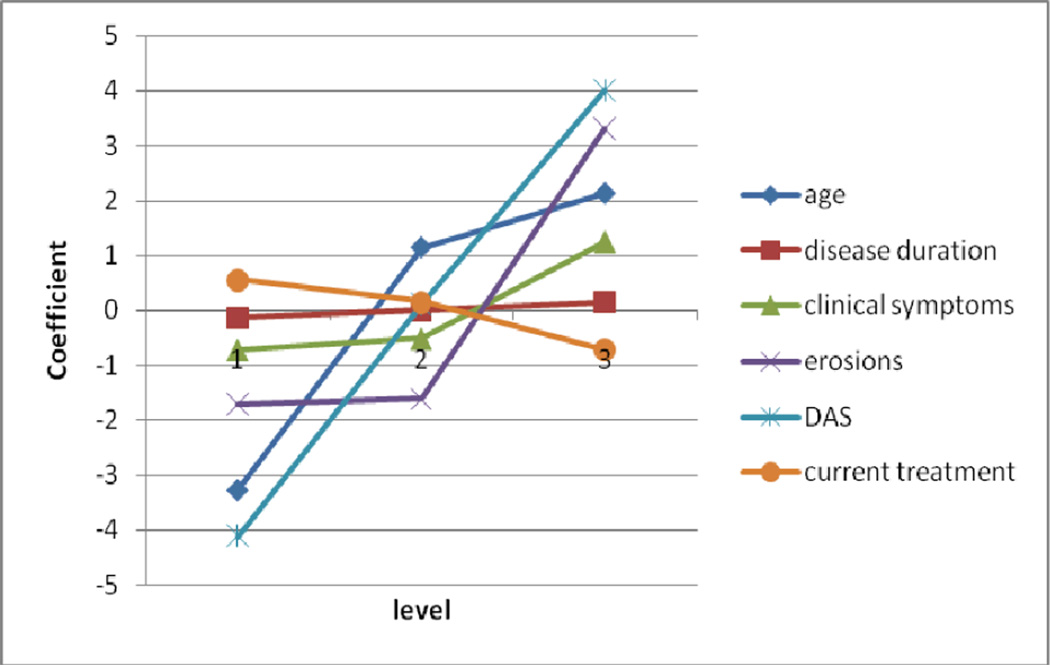
Figure 3.
Relationship between the utilities per level per attribute and the actual level
Age: 1=80 years old; 2=50 years old; 3= 25 years old
Disease duration: 1=RA diagnosed 2 years ago; 2=5 years ago; 3=10 years ago
Clinical symptoms: 1=Pain, swelling, stiffness about somewhat better than previous visit; 2=the same as previous visit; 3= somewhat worse than previous visit (level 1 and 2 are switched for this graph)
Erosions: 1= No erosions on recent x-rays; 2= No progression of erosions over the past year; 3= Some progression of erosions over the past year
DAS: 1= DAS today is 2.0 (low); 2= DAS today is 3.0 (moderate); 3= DAS today is 3.8 (high)
Current treatment: 1=On first TNF inhibitor; 2= On second TNF inhibitor; 3=Failed all TNF inhibitors now on abatacept

