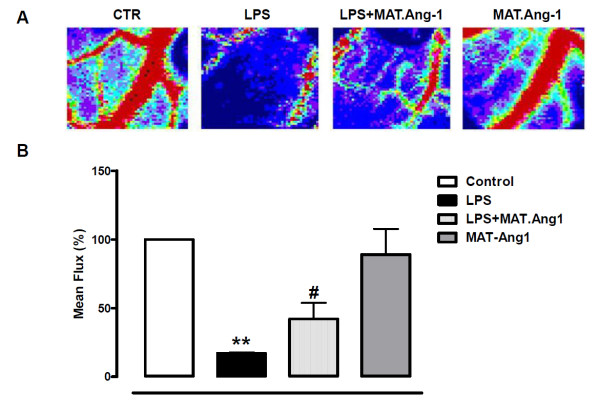
Figure 2.
MAT.Ang-1 ameliorates microvascular blood flow in sepsis. (A) Representative images from Doppler scanning at 24 hours of control (CTR), lipopolysaccharide (LPS), LPS + matrilin-1-angiopoietin-1 (MAT-Ang1) and MAT-Ang1 groups. Colours correspond to a perfusion range from 0 (black; lowest flux) to 1,000 (red; highest flux). (B) Data expressed as mean ± standard error of the mean of flux calculated as a percentage of control (n = 5). **P < 0.01 vs. control. #P < 0.05 vs. LPS.

