
Figure 1.
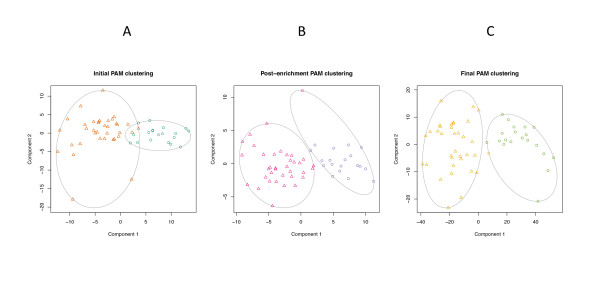
Results of PAM clustering through successive enrichment stages. In each plot, the patients are plotted within a two-dimensional space representing the greatest proportion of the variation in the dataset. The points in the first plot are colored according to the cluster assignments from the initial solution based on 365 sepsis-related genes found in Genbank. The colors in the second and third plots reflect the clustering from the preceding step. The symbols in each plot are determined by the results of the clustering at that stage. (A) Initial clustering based on the sepsis-specific genes found in Genbank. (B) Results of clustering following the 100-fold gene enrichment step. (C) Clustering based on the genes that were found to show differential expression after the SAM enrichment step.