
. 2012 Oct 28;16(5):R196. doi: 10.1186/cc11681
Copyright ©2012 Usuki et al.; licensee BioMed Central Ltd.
This is an open access article distributed under the terms of the Creative Commons Attribution License (http://creativecommons.org/licenses/by/2.0), which permits unrestricted use, distribution, and reproduction in any medium, provided the original work is properly cited.
Figure 1.
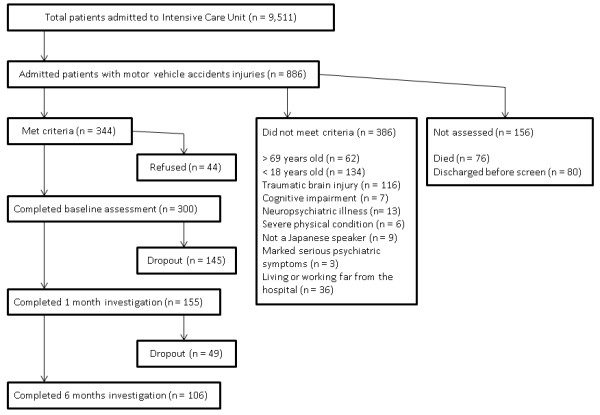
Flow chart of enrollment and follow-up.