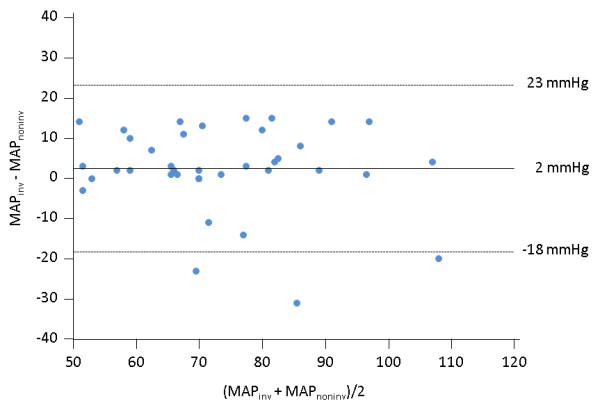
Figure 1.

Bland-Altman plot for the absolute values of mean arterial pressure obtained from the Nexfin device (MAPnoninv) and from the femoral arterial catheter (MAPinv) considering all the pairs of measurements performed during the study. N = 72; straight line, bias; dashed line, +2D/-2SD limits of agreement.
