
Figure 2.
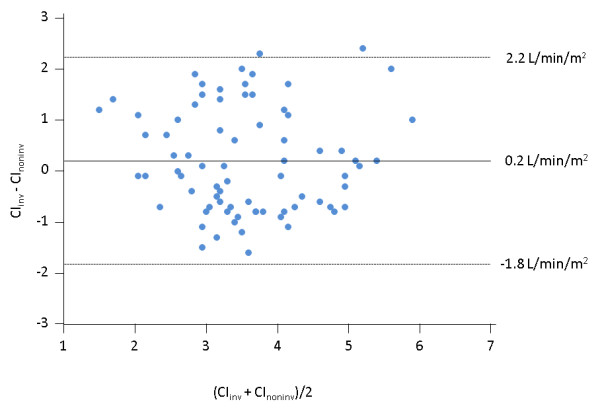
Bland-Altman plot for the absolute values of cardiac index obtained from the Nexfin device (CInoninv) and from transpulmonary thermodilution (CIinv) considering all the pairs of measurements performed during the study. N = 72; straight line, bias; dashed line, +2D/-2SD limits of agreement.