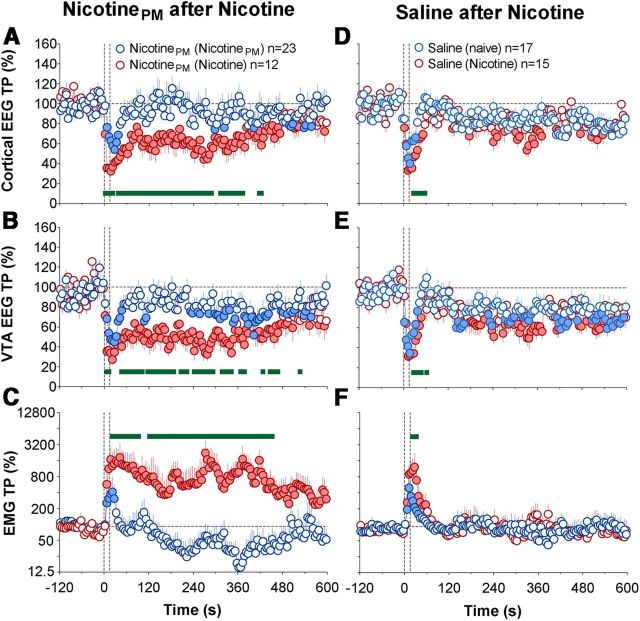
Figure 6.
Nicotine-like effects of nicotinePM after repeated nicotine exposure: cortical and VTA EEG and muscle EMG. A–C, Changes (mean ± SEM for 5 s time bins) in total powers of EEG desynhronization in the cortex (A) and VTA EEG (B) and EMG activation (C) induced by intravenous injections of nicotinePM after previous exposure to nicotinePM (blue) and nicotine (red). D–F, Changes in the same parameters induced by intravenous injections of saline after previous exposure to nicotine (red) and saline (blue). Filled symbols represent values significantly different from baseline. Green bold lines within each graph represent between-group differences in individual data points (p < 0.05). Two vertical hatched lines represent the timing of drug injection (0–15 s). EMG data were analyzed as ln derivatives and shown in ln-scale. Data are grouped depending upon the drug tested (nicotinePM or saline) and previous drug exposure: (NicotinePM) and (Nicotine), 2 d of nicotinePM or nicotine exposure; (saline) and (nicotine), 2 d of previous saline or nicotine exposure. n = number of averaged tests per group.

