
Figure 1.
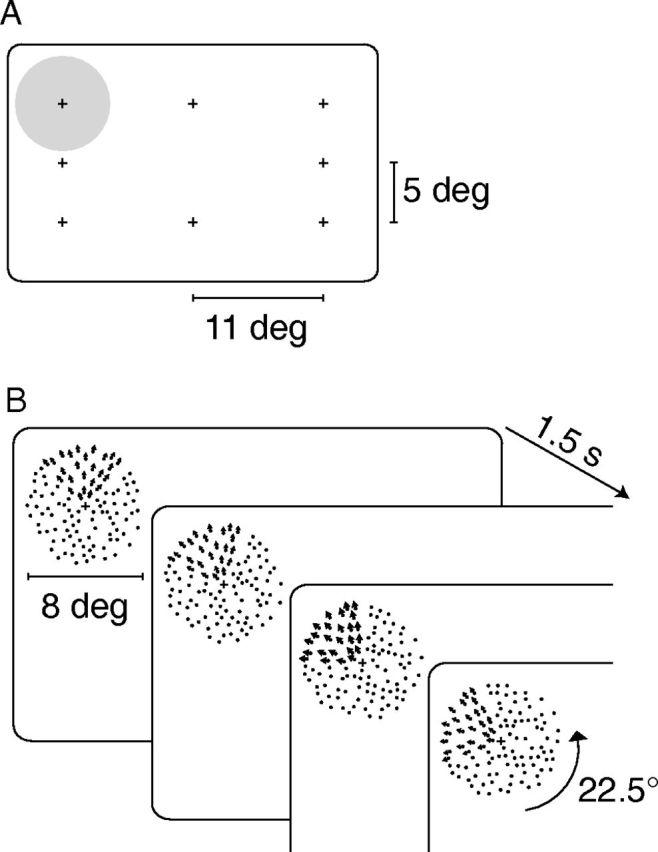
Schematic diagram of stimulus conditions. A, In each run, subjects fixated a cross located at one of eight possible screen locations, indicated by crosses at −11, 0, and +11° horizontal and −5, 0, and +5° vertical, excluding the screen center. Gray shaded circle centered at the upper leftmost fixation position (−11°, +5°) indicates the relative size of the stimulus. B, The stimulus consisted of a circular dot field (8° diameter) in which one-quarter of the dot field (a 90° wedge) moved radially, alternating between inward and outward motion every 750 ms. The motion-defined wedge rotated 22.5° every 1.5 s, completing a full rotation in 24 s. The wedge rotated through 10.5 cycles in a single scanning run. Eye position was held constant within each run and was varied across runs.