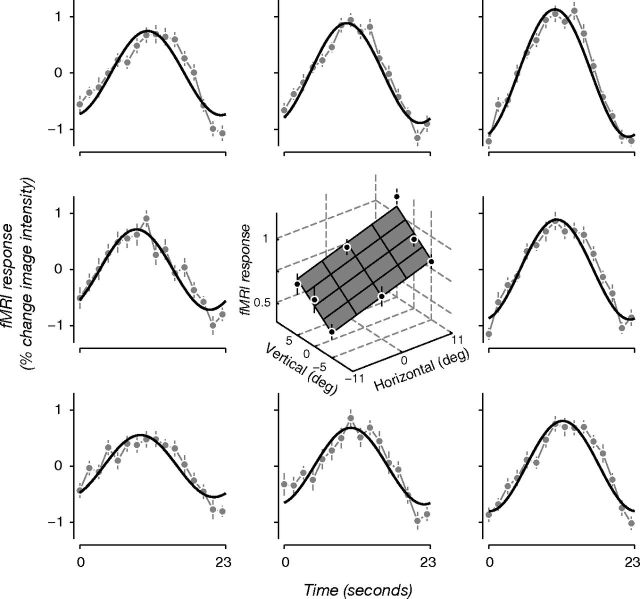
Figure 3.
Eye position modulates the amplitude, but not the phase, of visual responses. Time series plots show the cortical responses from a single voxel in area V3A for each of the eight eye positions tested in a single session. Gray dots and vertical lines indicate the average and SEM of the fMRI time series across 20 repeats of the stimulus at a particular eye position. Black curves indicate best-fitting sinusoidal model (amplitude and phase) of the responses. For this voxel, the amplitude was largest when the subject fixated up and to the right (+11°, +5°) and was smallest when the subject fixated down and to the left (−11°, −5°). Intermediate eye positions had response amplitudes that fell between the two extremes. The modulation of response amplitude with eye position was well fit by a plane with a particular angle and slope (center). The spatial selectivity of the responses, as measured by the phases of the best-fitting sinusoids, was invariant to changes in eye position.

