
Figure 5.
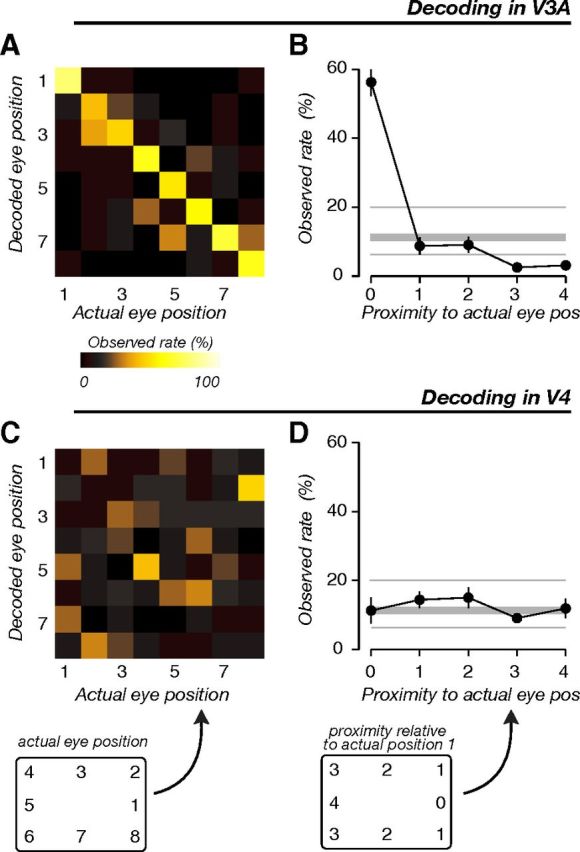
Eye position decoding. A, Confusion matrix for V3A, pooled across subjects and sessions. The confusion matrix depicts the percentage of repeats of each actual eye position (x-axis) for which each decoded eye position (y-axis) was obtained. High values along the diagonal indicate accurate decoding. B, Decoding pooled across actual eye positions. Data from the confusion matrix were averaged according to the proximity (inset below D) to the actual eye positions. Thick horizontal line indicates the median of the null distribution. Two thin horizontal lines indicate the 2.5th and 97.5th percentile of the null distribution. C, D, Decoding accuracy in V4 (same conventions as in A and B). Insets, Example of numbering of proximities of fixation positions for the case when the actual position was on the right at +11, 0.