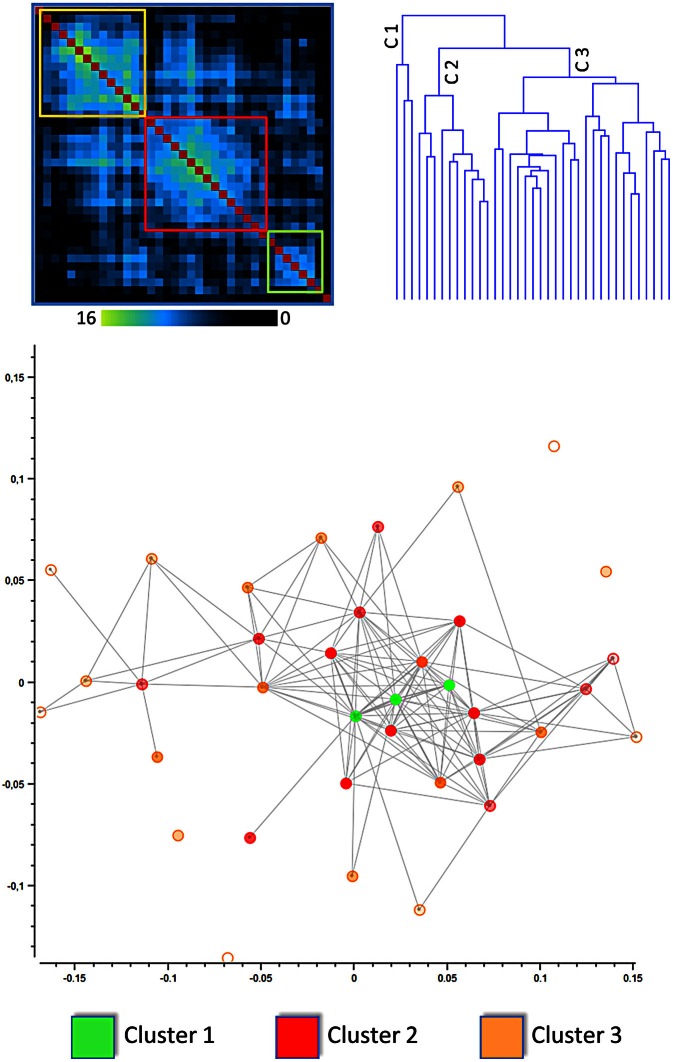
Figure 1.
Results of the clusterization of the cingulate cortex: distance matrix and multidimensional scaling (see also Figure 6 for network analysis). The upper left panel shows the results of the distance matrix. The upper right panel shows the dendrogram of the hierarchical clusterization, one of the algorithms used. The lower panel shows the Multidimensional scaling of the network derived from the distance between blocks of the cingulate cortex. The points represent blocks and are coded with a color indicating the cluster to which they belong. In this image the distance between points represents the Euclidean distance between the MACM maps of each block.

