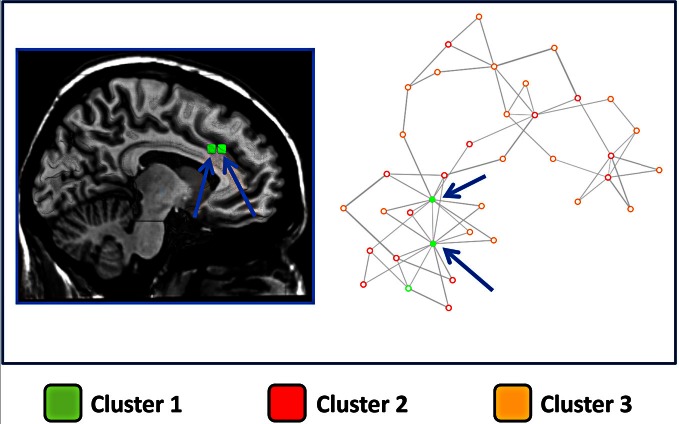
Figure 6.
Network derived from the distance between blocks of the cingulate cortex. Right panel: The points represent blocks and are coded with a color indicating the cluster to which they belong. In this image the distance between points represents the Euclidean distance between the MACM maps of each block. The network representation is optimized using a force-directed layout algorithm (Fruchterman–Reingold). Arrows indicate the two blocks with the highest number of connections. Left panel: the two blocks with the highest number of connections are graphically represented over a sliced standard brain surface.

