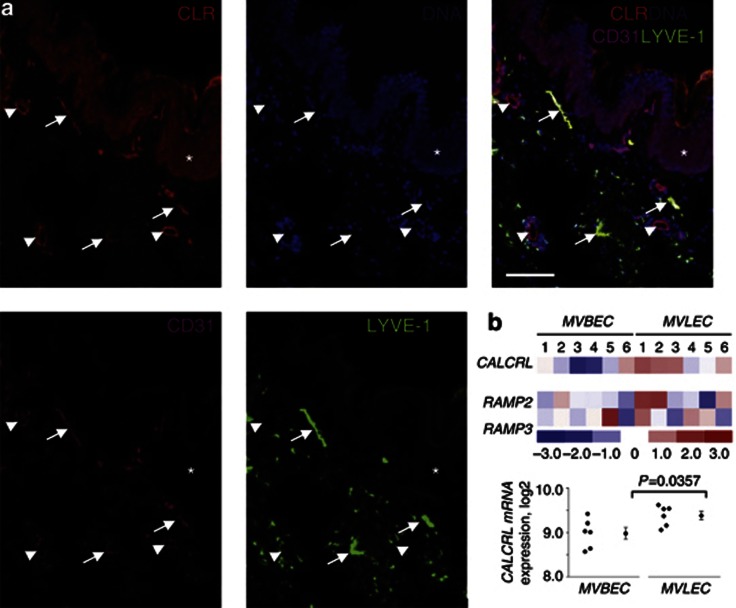
Figure 5.
CLR protein and CALCRL messenger RNA (mRNA) expression in human skin and primary dermal endothelium. (a) CLR, LYVE-1, and CD31 immunofluorescence and DAPI (DNA) staining (bar=75 μm). Lymphatic (CD31-positive/LYVE-1-positive; white arrows) and blood (CD31-positive/LYVE-1-negative; white arrowheads) vessel endothelium, and epidermis (white asterisk). (b) CALCRL, RAMP2, and RAMP3 mRNA expression in primary human dermal microvascular blood and lymphatic ECs (MVBEC and MVLEC) was determined using GeneChip Human Genome array data (E-MEXP-66) from 12 isolates as described in detail in Supplementary Methods online. Heatmap reflects relative changes in gene expression. Color scale—units of SD from the mean values of “rma” log2 expression units across all samples. Red, gene expression is significantly upregulated; blue, significantly downregulated; white, no significant change. A difference in CALCRL expression between MVBEC and MVLEC is also presented as dot plots (left) alongside the mean and SEM (right; Welch two-sample t-test).

