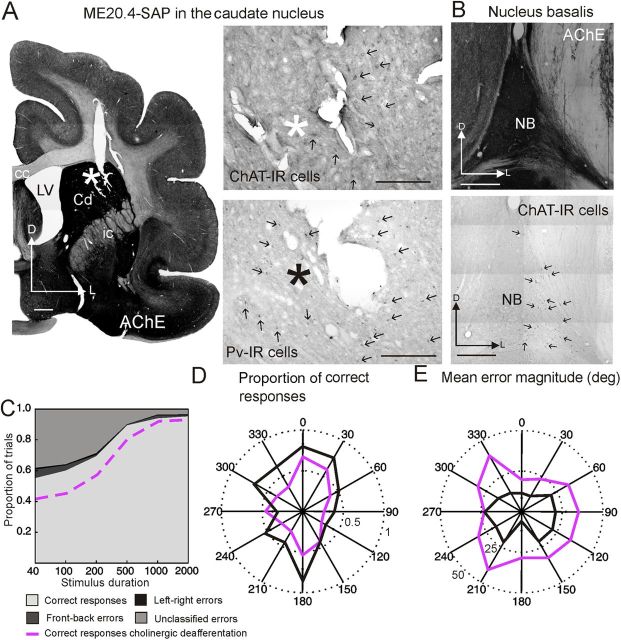
Figure 12.
Sound localization performance did not change after ME20.4-SAP immunotoxin injections in the caudate nucleus (Cd). A, Coronal section stained for AChE showing the ME20.4-SAP injection site in the Cd, plus higher magnification images of sections processed for ChAT and PV immunocytochemistry. Asterisks mark the end of the injection site, and arrows indicate immunopositive neurons. B, Coronal sections at the level of the NB stained for AChE and ChAT; note the large number of ChAT-IR cells. C, Approach-to-target localization responses at each stimulus duration. As in Figure 2, correct responses are shown in light gray, and incorrect responses are further subdivided into front–back errors (dark gray), left–right errors (black), and unclassified errors (mid-gray). The purple line indicates the mean percentage correct scores for the animals with cholinergic lesions of the NB. D, E, Polar plots illustrating the proportion of correct responses (D) and the mean error magnitude (E) at each peripheral speaker position when noise bursts with a duration of 40 ms were used. Data from the animals with ME20.4-SAP injections in the Cd and NB are shown in black and purple, respectively. Scale bars: A, left, low-magnification image, 1 mm; A, right, higher-magnification images, 0.5 mm; B, 0.25 mm. cc, Corpus callosum; ic, internal capsule; D, dorsal; L, lateral; LV, lateral ventricle.

