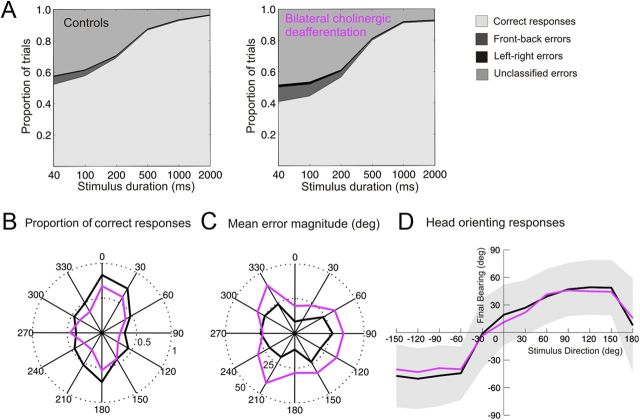
Figure 2.
Effect of cortical ACh depletion on auditory localization performance. A, Approach-to-target localization responses at each stimulus duration. Correct responses are shown in light gray, and incorrect responses are further subdivided into front–back errors (dark gray), left–right errors (black), and unclassified errors (mid-gray). B, Polar plot illustrating the proportion of correct responses (radial axis) at each peripheral speaker position for the two experimental groups when tested with 40 ms duration stimuli. Control animals are shown in black and animals with ME20.4-SAP cholinergic lesions in purple. C, Polar plot showing the mean error magnitude (radial axis, degrees) for each speaker position for a stimulus duration of 40 ms. D, Head orienting responses obtained in the same trials. Mean final head bearing is plotted against stimulus direction for each experimental group. The shaded region represents 1 SD about the mean for the control animals. The broadly sigmoidal dependence of head bearing on stimulus location was conserved across the two experimental groups.

