
Figure 3.
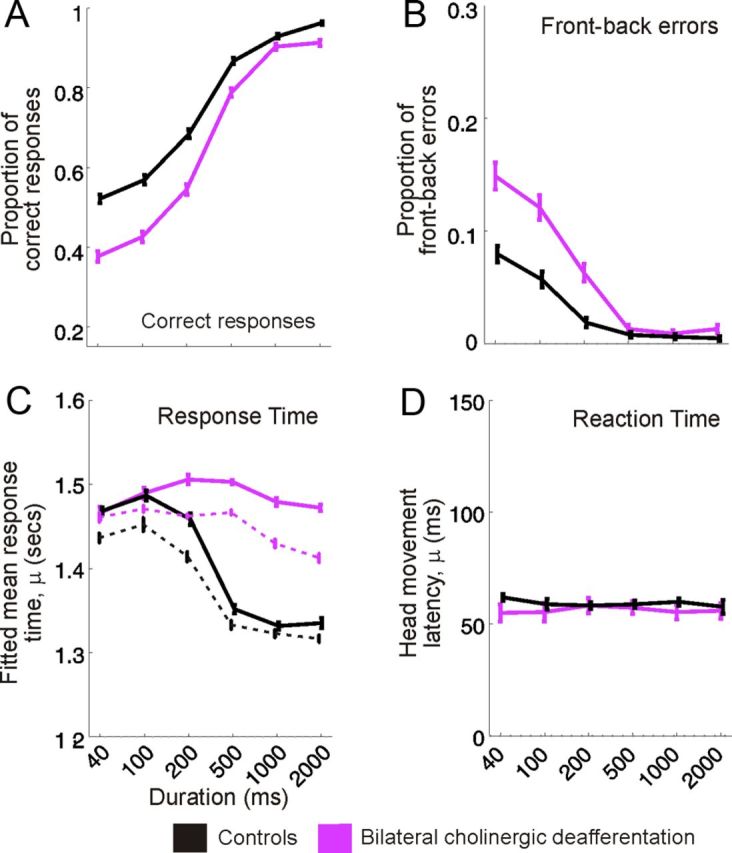
Stimulus duration-dependent effects of cholinergic modulation on localization performance. A, B, Mean ± SD proportion of correct responses and front–back errors, respectively, across stimulus duration for control animals (black) and animals with bilateral cholinergic deafferentation (purple). C, Response time between stimulus onset and the animal licking a peripheral reward spout, fitted using an ex-Gaussian distribution and bootstrapped 100 times, shown relative to stimulus duration for each experimental group. Solid lines represent the response times across all trials and dashed lines for correct trials only. The parameter μ represents the mean ± SD of the normally distributed response times. D, Latency of the initial head movement after sound onset (reaction time) for each experimental group across stimulus duration. The distribution of these reaction times was also described with a high degree of accuracy using an ex-Gaussian distribution, and the value plotted, μ, represents the mean ± SD of the normally distributed head movement latencies.