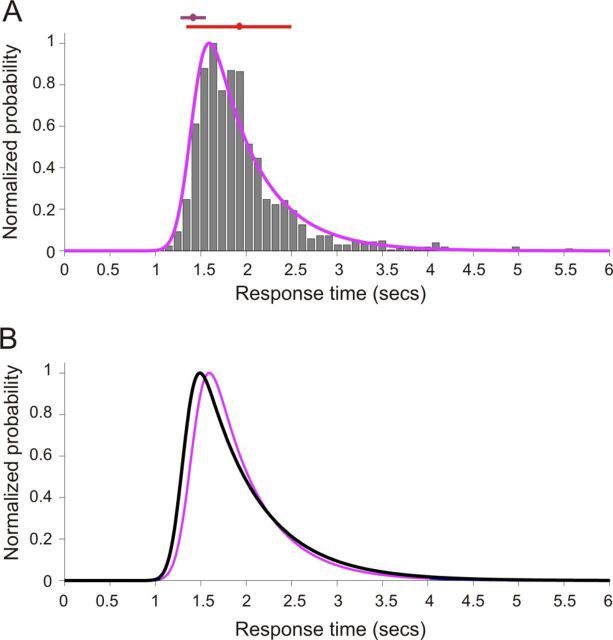
Figure 4.
A, Normalized histogram of response times in the approach-to-target localization task for ferrets with immunotoxin lesions of the NB. These values, which are binned at 100 ms, indicate the time between initiating a trial and licking a peripheral reward spout. An ex-Gaussian distribution was used to model these data in MATLAB using the DISTRIB toolbox available from http://darwin.psy.ulaval.ca/∼yves/distrib.html. The purple line represents the best-fit, ex-Gaussian model. The mean (μ) and SD (σ) of the Gaussian component of this function are represented by the purple circle and bounding lines, respectively. Mean response time (red circle) and SD (red line) further illustrate the non-normality of this distribution. B, Ex-Gaussian best fit of response times measured for a stimulus duration of 2000 ms in the approach-to-target localization task for ferrets with immunotoxin lesions of the NB (purple) and control animals (black), highlighting the delayed peripheral response times for lesioned ferrets at this stimulus duration.

