
Figure 3.
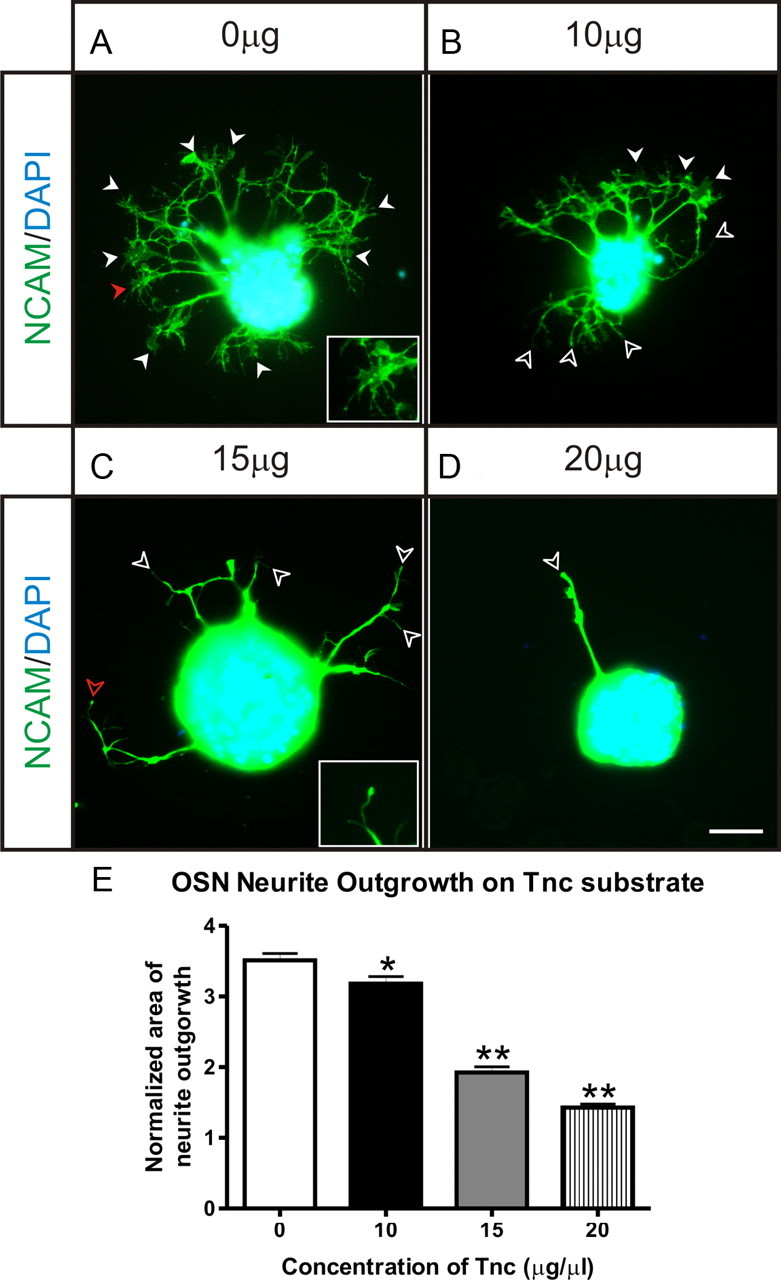
Dose–response of OSN neurite outgrowth on Tnc. Microexplants of olfactory epithelium plated on PDL-coated coverslips (50 μg/ml) that are subsequently coated with increasing concentrations of Tnc. Explants were grown for 48 h, fixed, and stained with NCAM (green) and DAPI (blue), and neurite outgrowth was assessed. A, In the absence of Tnc, OSNs extend neurites, and large spread growth cones are observed [arrowheads; see inset (high-magnification of growth cone indicated with red arrowhead)]. B, Explants grown on 10 μg/ml Tnc appear to have shorter neurites and fewer spread growth cones (solid arrowheads), with more neurites ending in blunt bull-nosed type growth cones (open arrowheads). C, The neurites extending from explants grown on 15 μg/ml Tnc were sparse, considerably less branched and tapered to blunt endings [open arrowheads; see inset (high-magnification of growth cone indicated with red open arrowhead); compare inset in A]. No spread growth cones were observed. D, Explants grown on 20 μg/ml Tnc were occasionally observed to extend neurites. Often no neurites were extended (see C). When neurites were extended, they had few or no branches and tapered to a blunt end (open arrowhead). E, Quantification of dose–response of neurite outgrowth on Tnc. Neurite outgrowth was determined by measuring total area of NCAM staining and dividing by the area of DAPI staining, to normalize for variability in explant size. Approximately 50 explants (49, 54, 47, 55, respectively) were analyzed for each condition (taken from 3 independent replicates) and analyzed using a one-way ANOVA with Dunnett's multiple-comparison post hoc test. Significant differences were observed in the ANOVA (p < 0.0001), and tenascin-C was found to be an inhibitory molecule for OSN neurite outgrowth, with significant differences found between control (0 μg/ml Tnc) and each Tnc concentration tested in a dose-dependent manner using Dunnett's multiple-comparison test: 0 versus 10, p < 0.05; 0 versus 15, p < 0.01; 0 versus 20, p < 0.01. Error bars indicate ± SEM. *p < 0.05. **p < 0.01. Scale bar, 50 μm.