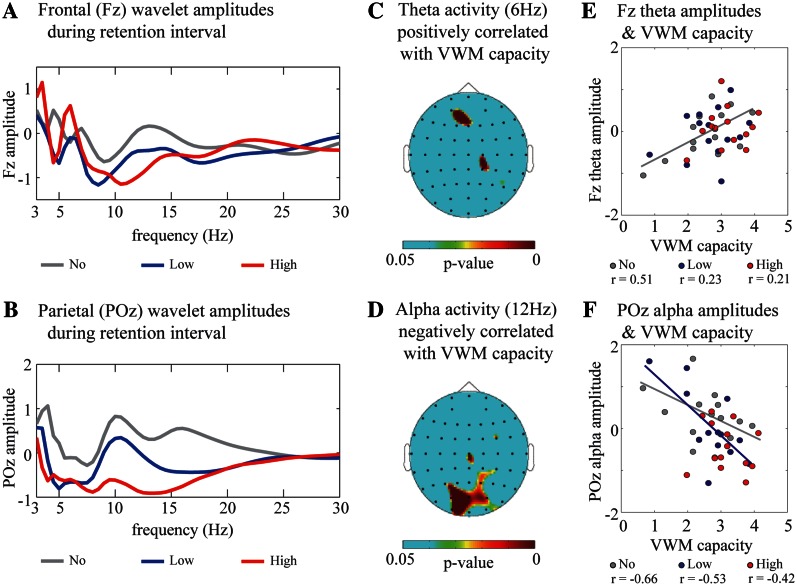
Fig. 2.
(A and B) Subject-averaged (N = 14) and time-averaged (2-s retention interval) frequency amplitudes under the no- (gray), low- (blue) and high- (red) reward conditions on the frontal (A, Fz electrode) and parietal (B, POz electrode) regions. These values, normalized with respect to the ITI baseline, were averaged across correct trials of all participants. (C and D) Topographic colored scalp maps of the P-values for the theta (C, 6 Hz) and alpha (D, 12 Hz) delay-period amplitudes that were significantly correlated with VWM capacity. (E and F) Scatter plot of VWM capacity and the Fz theta amplitudes (E) and POz alpha amplitudes (F) under the no- (gray), low- (blue) and high- (red) reward conditions, by averaging across VWM load (three and six objects).

