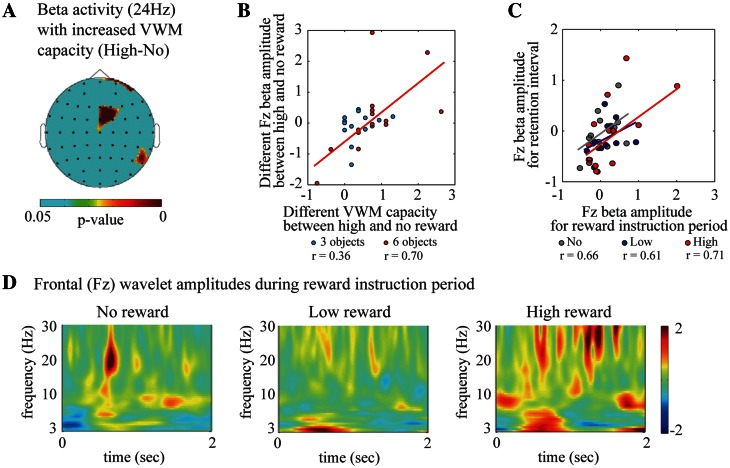
Fig. 3.
(A) The topographic colored scalp maps of the P-values for the beta delay-period amplitudes, which were significantly correlated with increasing VWM capacity under the high-value compared with no-reward conditions. (B) A scatter plot of VWM capacity difference against Fz beta amplitude differences under the high-value and no-reward conditions when three (cyan) or six objects (red) were presented in the sample display. (C) A scatter plot of the Fz beta amplitude between the reward instruction period and the retention interval under the no- (gray), low- (blue) and high- (red) reward conditions by averaging across VWM load (three and six objects). (D) Subject-averaged time–frequency amplitudes during the reward instruction periods under the no- (left), low- (center) and high-reward (right) conditions on the Fz electrode.

