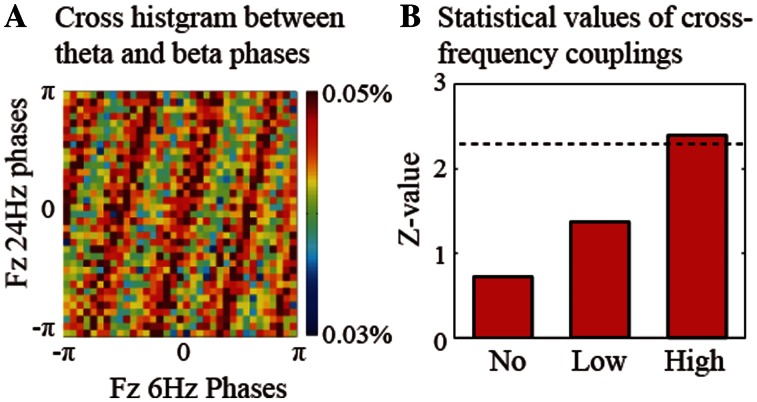
Fig. 4.
(A) Cross histogram of the probability distributions between the theta (6 Hz) and beta (24 Hz) phases during the retention interval. (B) Z-values of the cross-frequency PSI between the theta and beta phases at Fz during the retention interval. The dotted line denotes the threshold value (P < 0.01).

