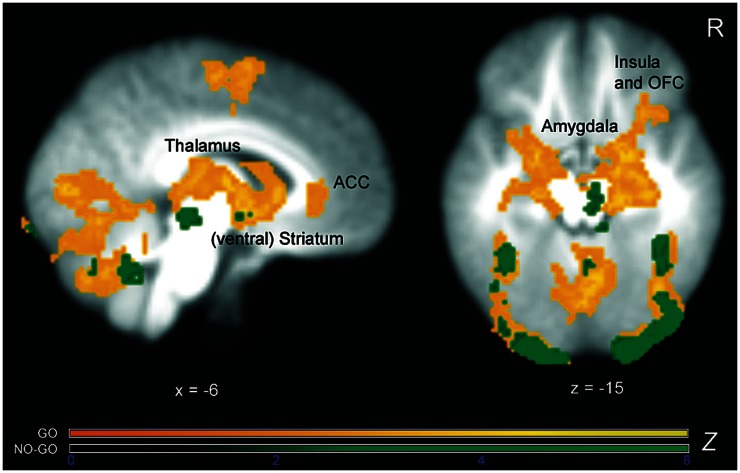
Fig. 2.
Z-statistic activation maps of the combined reward > non-reward contrast separately for go and no-go condition across the whole sample overlaid on the averaged group T1 image (cluster-corrected for multiple comparisons with a mean cluster threshold of Z > 2.3 and a cluster-corrected significance threshold of P ≤ 0.05). Color bars indicate Z-statistics. As expected, and in line with prior imaging research, reward obtained during go blocks led to strong and widespread activation within the motivation circuitry, comprising striatum, amygdala, thalamus, insula and prefrontal areas. In contrast, reward obtained during no-go blocks activated only a small number of reward areas such as midbrain and striatum.

