
Figure 1.
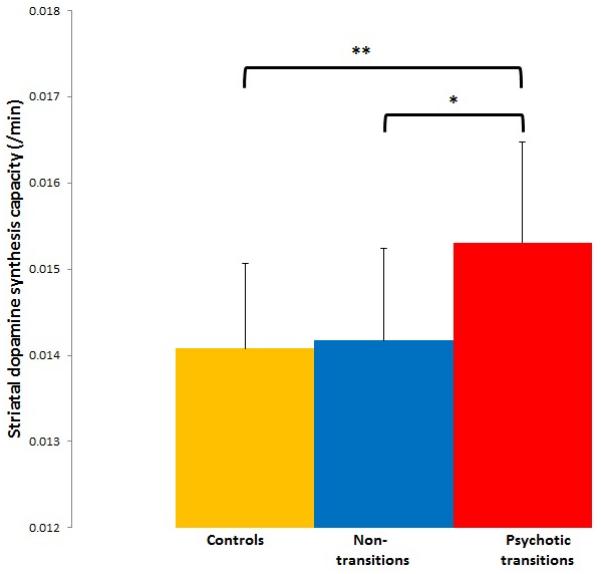
Showing mean (error bars=SD) dopamine synthesis capacity (kicer values) for the whole striatum in psychotic transition (N=9), non-transition (N=15) and control (N=29) groups. There were significant differences between psychotic transition and control groups (**p=0.004 corrected) and between the psychotic transition and non-transition groups (*p=0.015 corrected).