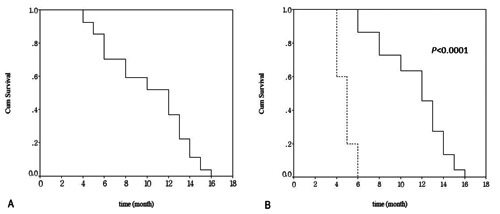
Figure 4.

Kaplan-Meier curve of overall survival for the patients. A) Survival curve of patients with small cell carcinoma of the gastrointestinal tract with limited stage; B) survival curves for the patients with and without chemotherapy (Solid line: surgery + chemotherapy; dashed line: surgery; P<0.0001)
