
Fig. 1.
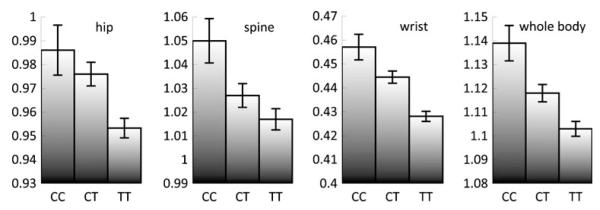
Unadjusted BMD values according to genotype at rs7776725. Data are expressed as means±SE (error bars). The adjusted BMD values in subjects with rs7776725 genotypes CC:CT:TT were as follows: 0.0206:0.0090:−0.0096 at hip; 0.0259:0.0020:−0.0055 at spine; 0.0202:0.0072:−0.0084 at wrist; and 0.0279:0.0064:−0.0089 at whole body. These are consistent with the results of the unadjusted BMD values in this figure