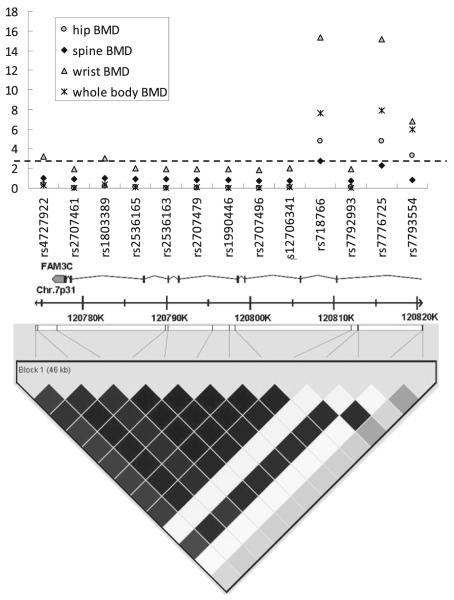
Fig. 2.
LD plot and the association results of SNPs in FAM3C region. Upper panel: The association results of rs7776725 and other 12 SNPs. y-axis: -log10(p-value). The dashed line shows the significant threshold for the association results of these 12 SNPs. Lower panel: Pairwise LD plot for SNPs studied (rs4727922, rs2707461, rs1803389, rs2536165, rs2536163, rs2707479, rs1990446, rs2707496, rs12706341, rs718766, rs7792993, rs7776725 and rs7793554 from left to right) based on genotyping data in the KC-population. LD is colored with the correlation coefficients r2 scheme. White means r2=0. Squares are colored darker if the r2 value is higher. Black means r2=1. All the markers were shown to be grouped into a single LD block when analyzed with the “Four gamete rule” or “solid spine of LD” option in Haploview software

