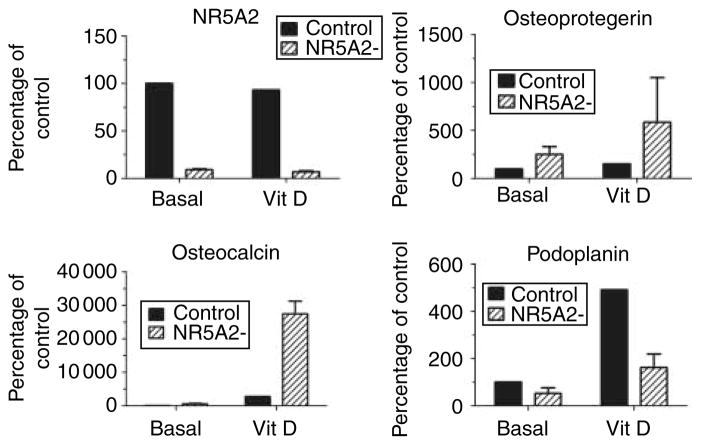
Figure 1.
Gene expression in unstimulated and 1,25-dihydroxyvitamin D3-stimulated HOS-TE85 osteoblastic cells. The results represent the mean and S.D. of gene expression in two clones with stable inhibition of NR5A2, shown as the percentage of gene expression in unstimulated control cells. Similar results were obtained in three independent experiments.

