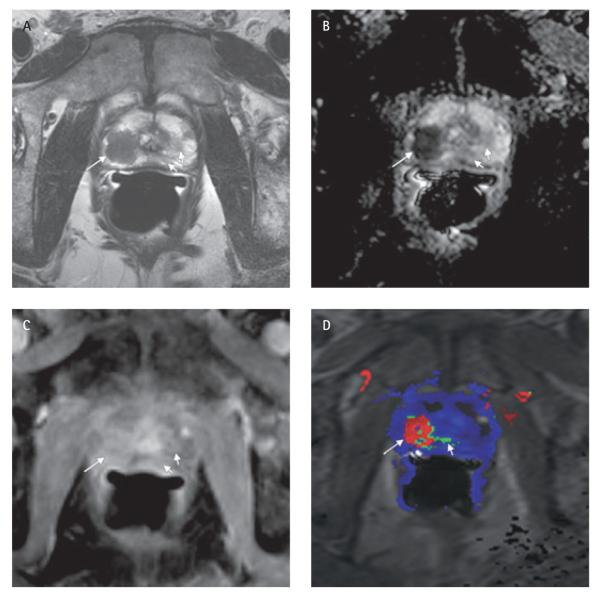
FIG. 1.
Images showing the value of multi-parametric MRI for identifying the dominant lesion in a 58-year-old man with a preoperative PSA level of 11.9 ng/mL, in whom surgical pathology showed pT2b prostate cancer of Gleason score 8 (4 + 4). (A) T2-weighted image; (B) apparent diffusion coefficient (ADC) map; (C) dynamic contrast-enhanced T1-weighted image; and (D) colour-coded map showing peak enhancement. Marked differences in T2 signal, ADC values, and contrast enhancement can be seen between the dominant lesion (Gleason score 8; long arrows) at the right apex and a smaller lesion (Gleason score 6; short arrows) on the left side.

