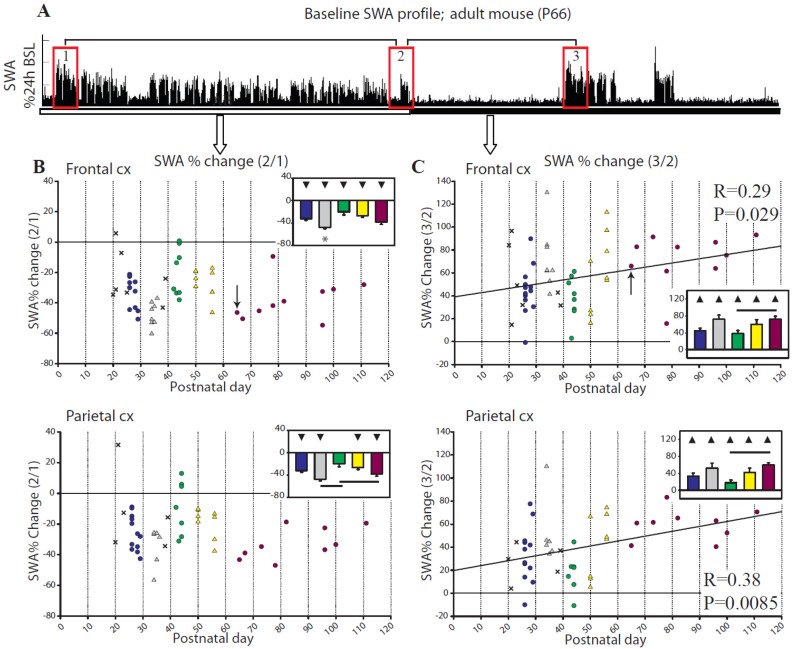
Figure 4.
Baseline changes in relative NREM SWA. (A) shows changes in relative SWA for the frontal derivation in a representative adult (P66) mouse (indicated by an arrow in B,C). Boxes 1,2,3 indicate first and last hour of consolidated sleep during the light period, and first hour of consolidated sleep at night, respectively. The ratios 2/1 and 3/2 were used for the analysis shown in (B) and (C). Bars show differences across groups (Tukey’s HSD), and triangles indicate group means different from 0 (t-test; filled symbols p<0.05).

