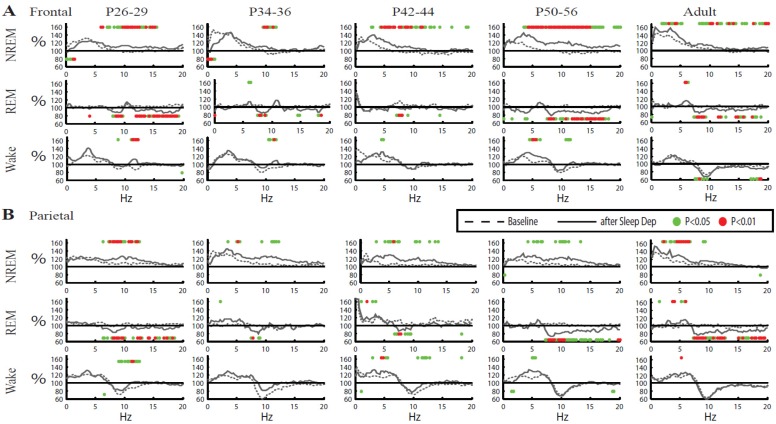
Figure 8.
Overall changes in EEG power spectra after sleep deprivation for all vigilance states. Mean EEG spectra for NREM sleep, REM sleep and wake during baseline (dotted line) and sleep deprivation (solid line) are plotted in 0.25 Hz frequency bins. The mean of each frequency bin is expressed relative to its 24-h baseline mean. Spectra for NREM sleep refer to the first hour from sleep onset, when most SWA rebound occurs. Since little REM sleep occurs during the first hour of recovery, spectra for REM sleep and wake are instead mean of the first 4 h from sleep onset. Dots above and below traces indicate significant increases and decreases, respectively, after sleep deprivation vs. baseline (p < 0.05 red, p < 0.01 green; one sample, 2-tailed t-test).

