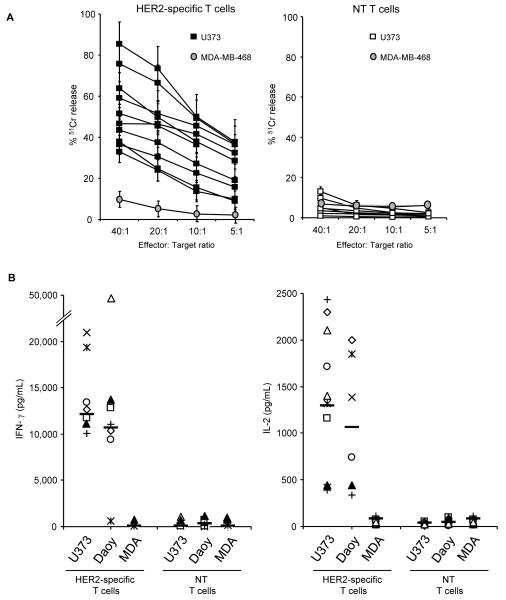
Figure 1. Functionality of HER2-specific T cells from subjects with GBM.
HER2-specific and non-transduced (NT) T cells, generated from newly-diagnosed GBM patients, were co-cultured with HER2-positive (U373 or Daoy) or HER2-negative (MDA-MB-468) cells. (A) Only HER2-specific T cells killed HER2 positive targets, in a 4 hour 51Cr release cytotoxicity assay; NT T cells did not. The HER2-negative cell line MDA-MB-468 (MDA) was not killed by HER2-specific or NT T cells (mean and standard deviation for all patients are shown). Results from experiments done for 9 GBM patients in triplicates are shown. (B) in coculture assays performed at a 1:1 T-cell to tumor cell ratio, the IFN-γ and IL-2 concentration was determined in the coculture supernatant 24 to 48 hours post stimulation. Only HER2-specific T cells produced IFN-γ and IL-2 after exposure to HER2-positive cells in comparison to NT T cells. Results from experiments done in duplicates are shown.

