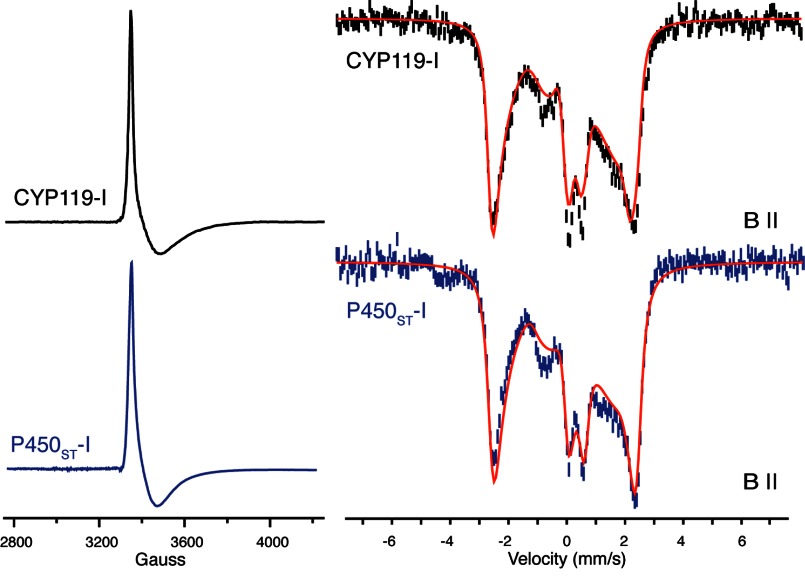
FIGURE 3.
Comparison of the EPR (left) and Mössbauer (right) spectra of CYP119A1-I and P450ST-I. Mössbauer spectra were recorded at 4.2 K with a 54-millitesla field oriented parallel to the γ-beam. Mössbauer spectra were obtained by subtracting contributions of ferric enzyme (30 and 35%, respectively) from the raw data. Fits of the Mössbauer data (shown in red) yield the following parameters: P450ST-I, ΔEQ = 0.85 mm/s and δ = 0.12 mm/s; and CYP119A1-I, ΔEQ = 0.90 mm/s and δ = 0.11 mm/s. The EPR spectra were obtained as reported previously (1). Fits of the P450ST-I EPR data indicate |J/D| = 1.3 and g = 1.95, 1.84, and 1.99, in good agreement with the values reported previously for CYP119A1-I (1).

