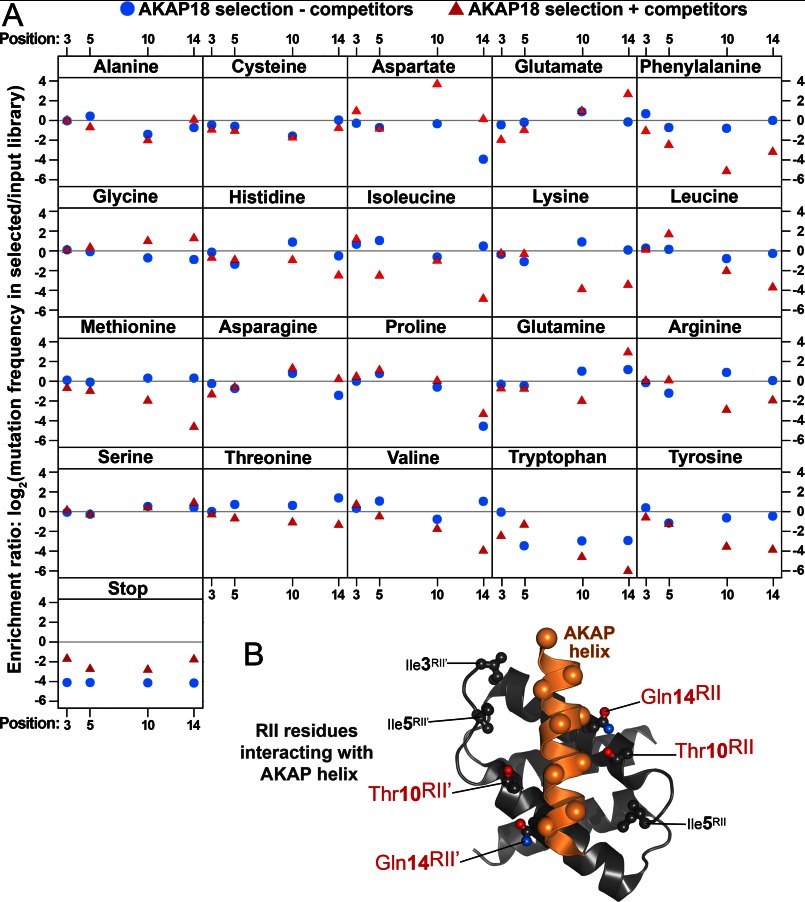
FIGURE 5.
Sequence-function plot of RII variant selection with AKAP18. A, the relative changes in the frequency of each amino acid at the four variable RII positions are shown after three rounds of selection using GST-AKAP18 in either the presence (red triangles) or absence (blue circles) of competitor AKAP peptides. Amino acid mutations that increased in frequency relative to the input library have positive log-transformed enrichment ratios as a consequence of improved binding. B, structural representation of positions 3, 5, 10, and 14 in wild-type RII in relation to an AKAP anchoring helix (orange).

