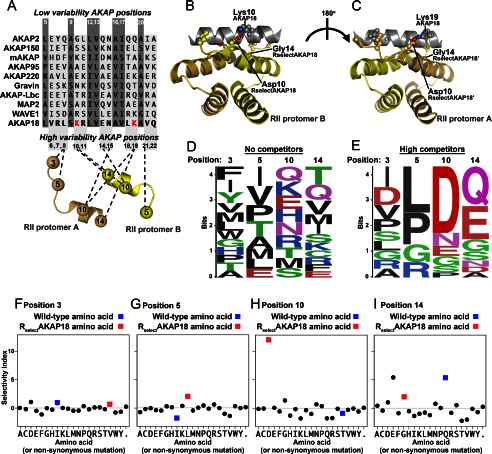
FIGURE 6.
Structural basis of RSelect selectivity A, alignment of AKAP anchoring helices. Variable positions are shown in light gray, and highly conserved small aliphatic residues are shown in dark gray (upper). RII protomer residues 3, 5, 10, and 14 are shown below with dashed lines indicating interaction with variable AKAP positions. B and C, structural representations of a structural model of RSelectAKAP18 in complex with the anchoring helix of AKAP18. D and E, Logo plots of an early round of selection with AKAP18 in the absence (D) or presence (E) of competitor AKAP peptides. Amino acid mutations that increased in frequency after selection were used to generate a Logo plot, where the height of each amino acid indicates its frequency at that position (WebLogo). The selectivity index for each amino acid substitution is shown at positions 3 (F), 5 (G), 10 (H), and 14 (I) in the RII sequence. Black circles indicate selectivity index scores, blue squares denote wild-type RII amino acids, and red squares denote RSelectAKAP18 amino acids.

