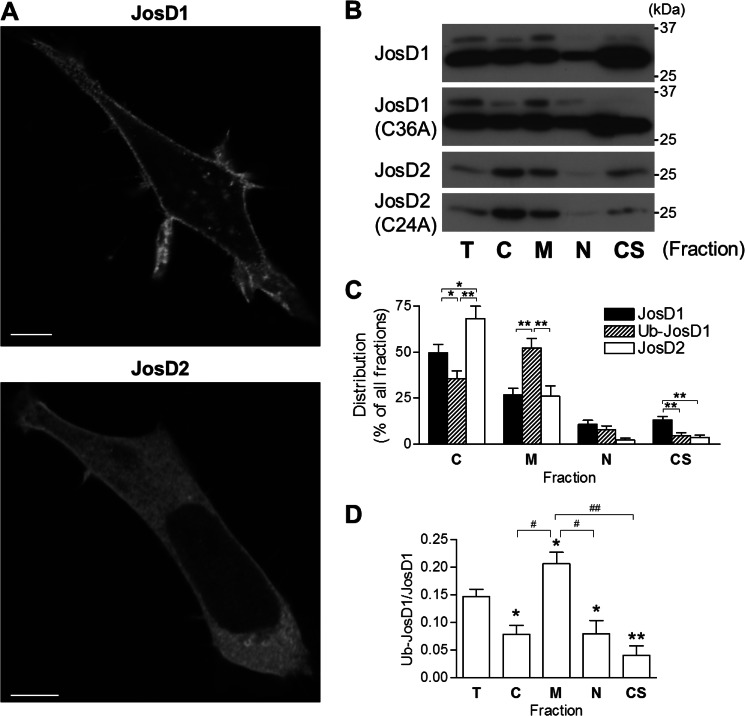
FIGURE 3.
JosD1 and JosD2 differ in subcellular localization. A, HEK-293 cells expressing JosD1-V5 (upper panel) and JosD2-V5 (lower panel) immunostained with anti-V5 antibody. JosD1 localizes to the plasma membrane and cytoplasmic puncta, whereas JosD2 localizes diffusely throughout the cytoplasm and is largely excluded from the nucleus. Scale bars, 10 μm. B, subcellular fractionation of cells expressing JosD1 or JosD2. Transfected cells were fractionated into cytosolic (C), membrane (M), nuclear (N), and cytoskeletal (CS) fractions. Equal amount of protein from total cell lysates (T) and the four indicated fractions were subjected to SDS-PAGE, followed by immunoblotting with anti-V5 antibody. Images are representative of five independent experiments. Catalytically inactive mutants of JosD1 and JosD2 show distribution similar to wild-type JosD1 and JosD2. C, quantification of subcellular distribution of JosD1, Ub-JosD1, and JosD2. Ub-JosD1 preferentially localizes to the membrane fraction over nonubiquitinated JosD1. Shown are mean values from five independent experiments. Error bars, S.E. *, p < 0.05; **, p < 0.01 (unpaired t test). D, quantification of the Ub-JosD1/JosD1 ratio in each fraction. The ratio is significantly higher in the membrane fraction and significantly lower in the other three fractions compared with the ratio for the total cellular pool. Shown are mean values from five independent experiments. Error bars, S.E. *, p < 0.05 versus total cell lysate (T); #, p < 0.05; ##, p < 0.01 (unpaired t test).

