FIGURE 6.
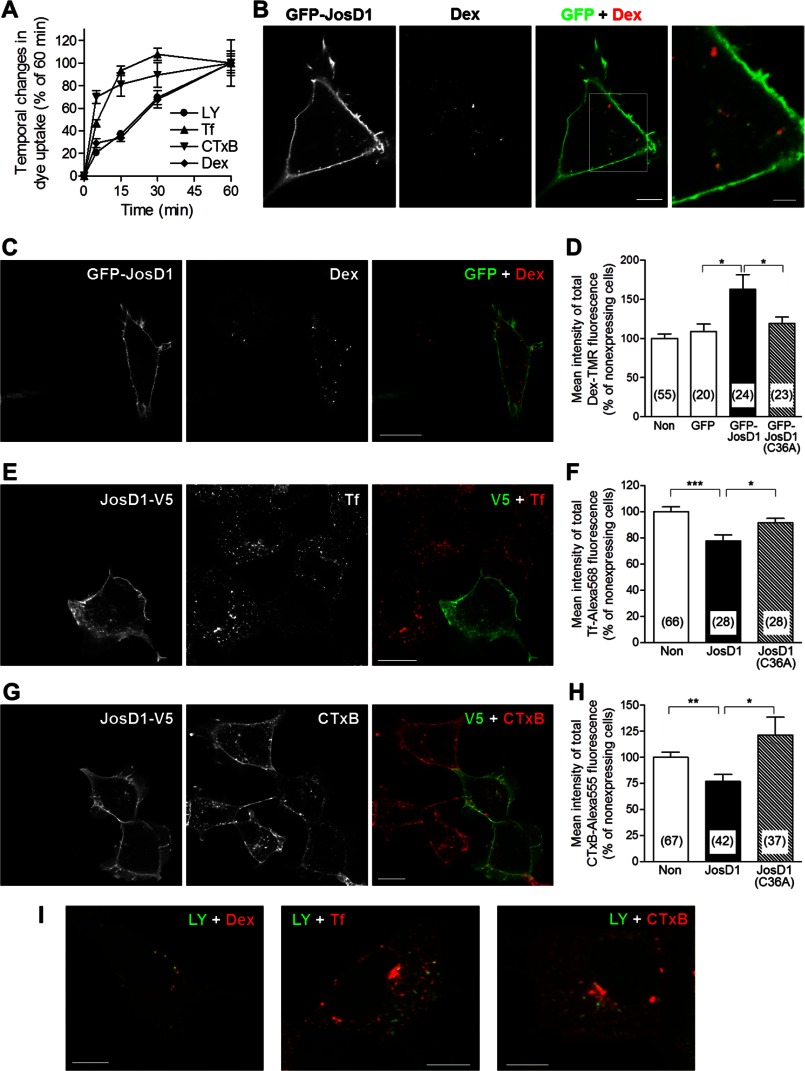
JosD1 overexpression enhances macropinocytosis but suppresses clathrin-mediated and caveolae-mediated endocytosis. A, time course of uptake of fluorescent dyes used to detection various types of endocytosis in HEK-293 cells. Mean fluorescence intensity of each dye was plotted after 5, 15, 30, and 60 min. Uptake of Tf and CTxB nears saturation at around 15 min, whereas LY and Dex uptake increases continuously over 60 min. B, partial co-localization of GFP-JosD1- and Dex-positive puncta. Representative fluorescence images (GFP, Dex, and merged) of cells expressing GFP-JosD1 are shown. Far right image is higher power magnification views of boxed area in merged image. Scale bars of merged and high magnification images are 10 and 5 μm, respectively. C and D, uptake of Dex-TMR, a marker of macropinocytosis, in HEK-293 cells expressing GFP-JosD1. C, representative cell images visualizing GFP (left), Dex-TMR (center), and merged (right). Scale bar, 20 μm. D, quantification of mean intensity of total Dex-TMR fluorescence showing that Dex uptake is significantly increased in cells expressing JosD1, but not JosD1(C36A). E and F, uptake of Tf-Alexa Fluor 568, a marker of clathrin-mediated endocytosis, in cells expressing JosD1-V5. E, representative cell images, viewed by V5 tag immunofluorescence (left), Tf-Alexa Fluor 568 (center), and merged (right). Scale bar, 20 μm. F, quantification of mean intensity of total Tf-Alexa Fluor 568 fluorescence showing that Tf uptake is significantly decreased in cells expressing JosD1-V5 but not JosD1(C36A)-V5. G and H, uptake of CTxB-Alexa Fluor 555, a marker of caveolae-mediated endocytosis, in cells expressing JosD1-V5. G, representative cell images, viewed by V5 tag immunofluorescence (left), CTxB-Alexa Fluor 555 (center), and merged (right). Scale bar, 20 μm. H, quantification of mean intensity of total CTxB-Alexa Fluor 555 fluorescence showing that CTxB uptake is significantly decreased in cells expressing JosD1-V5 but not JosD1(C36A)-V5. For D, F, and H, means ± standard errors (error bars) are shown. Numbers in parentheses indicate the number of cells analyzed in each group. *, p < 0.05; **, p < 0.01; ***, p < 0.001, unpaired t test. I, Uptake of LY with Dex (left), Tf (center), or CTxB (right) in the same cell for 60 min. LY puncta strongly co-localized with Dex puncta, but only partially co-localized with Tf and CTxB puncta. Scale bars, 10 μm.

