FIGURE 4.
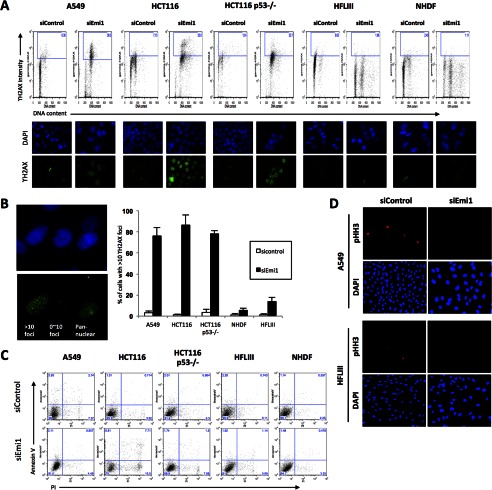
DNA damage in Emi1 depleted cancer cells. A, Emi1 knockdown induce γH2AX foci in tumor cells. Tumor cells (A549, HCT116, and HCT116 p53−/−) and normal cells (HFLIII and NHDF) were transfected with the indicated siRNA. After 48 h the transfection, cells were fixed and stained with anti-γH2AX antibodies. The levels of H2AX phosphorylation were detected using by the flow cytometer. Bivariate distributions representing expression of γH2AX versus DNA content of tumor and normal cells are shown. The levels of H2AX phosphorylation were also detected using by the fluorescence microscope. Representative images of γH2AX immunostaining (green) and nuclear staining (blue) in tumor or normal cells are shown. B, images on the left show typical images of cells presenting low (0∼10 foci/cell) or high levels of γH2AX foci or showing pan-nuclear staining γH2AX. The right graph indicates percentages of cells with high level (>10 foci/cell) of γH2AX foci. Results presented are the means of two independent experiments ± S.D. C, apoptosis was examined by annexin V staining using a flow cytometer in various cells (A549, HCT116, HCT116 p53−/−, HFLIII, and NHDF) after control siRNA or Emi1 siRNA treatment. D, expression of phosphohistone H3 (pHH3) was examined by the fluorescence microscope in A549 and HFLIII cells after control siRNA or Emi1 siRNA treatment. Cells were also stained with DAPI to visualize the nuclei.

