FIGURE 10.
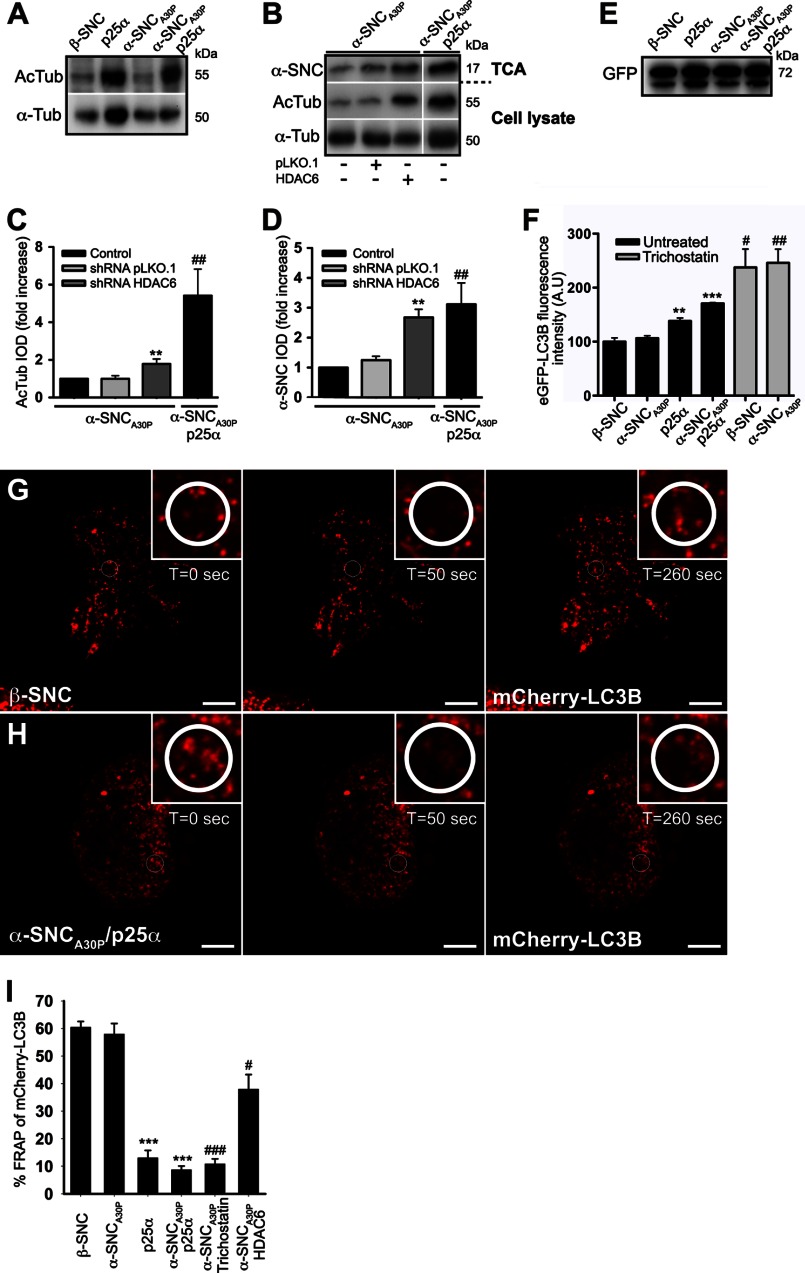
HDAC6 inhibition mimics p25α-induced secretion of α-synuclein and reduces the mobility of autophagosomes. A, representative Western blots showing cellular protein levels of acetylated tubulin (AcTub) and α-tubulin (α-Tub) obtained from PC12 cell populations as indicated. B, cell lysates and conditioned medium from PC12-α-synucleinA30P (α-SNCA30P) or PC12-α-SNCA30P/p25α cells, transduced 3 to 4 days prior to analysis with lentivectors expressing control (pLKO.1) or HDAC6-specific shRNA, were subjected to Western blotting using anti acetylated tubulin and α-tubulin antibodies (cell lysates) or anti-α-SNC antibodies (TCA-precipitated medium; BD Transduction Laboratories). Integrated optical density (IOD) of western bands for acetylated tubulin in cell lysates (C) and secreted α-SNC (BD Transduction Laboratories) in the TCA samples (D) is presented as fold increase relative to untreated control cells. Mean ± S.E. of three independent experiments are shown. * denotes a statistically significant increase in IOD within the cell line when co-expressing shRNA, and # denotes a statistic significant increase in IOD between the control cell lines not expressing shRNA. E, cell lysates of PC12 cell populations as indicated, expressing mCherry-eGFP-LC3B were Western blotted with anti-GFP antibodies to demonstrate an equal expression of the LC3B fusion protein. The 72-kDa protein bands correspond to the size of the mCherry-eGFP-LC3B tandem construct. F, flow cytometric analysis of untreated or trichostatin A-treated (10 μm) PC12 cell populations expressing mCherry-eGFP-LC3B. The bar graph shows mean ± S.E. of eGFP relative light fluorescent units normalized to control cells expressing β-SNC and represents data from three independent experiments. * denotes a statistic significant increase in mean eGFP fluorescence intensity between the cell lines when compared with β-SNC-expressing PC12 cells, and # denotes a statistic significant increase after trichostatin treatment. A.U., arbitrary units. G and H, live cell confocal microscopy images of PC12 cells expressing β-SNC or α-SNCA30P/p25α showing FRAP time series before and after photobleaching (t = 0 s and t = 50 s), and after a defined recovery period (t = 260 s). The cells were bleached in the encircled ROI shown in close-ups just before the t = 50-s time point. Bars, 10 μm. I, bar graph shows percentage of FRAP in PC12 cells as indicated, including PC12-α-SNCA30P cells treated with 20 μm trichostatin A or transduced with HDAC6 shRNA. Mean ± S.E. were obtained from three to five independent experiments. * denotes a statistically significant decrease in FRAP between the cell lines when compared with β-SNC-expressing PC12 cells, and # denotes a statistically significant decrease after trichostatin treatment or HDAC6 shRNA co-expression when compared with PC12 cells expressing α-SNCA30P.

