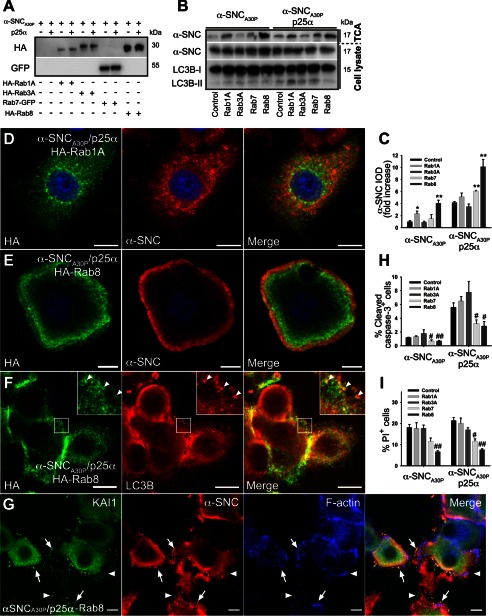
FIGURE 11.
Expression of Rab8 enhances α-synuclein secretion while lowering cell death. A, representative Western blots showing expression levels of HA-tagged Rab1A, Rab3A, or Rab8 and GFP-tagged Rab7 in PC12 cell lines expressing α-synucleinA30P (α-SNCA30P) or α-SNCA30P and p25α using anti-HA or -GFP antibodies. B, representative Western blots of TCA-precipitated media and cell lysates obtained from PC12 cells expressing α-SNCA30P or α-SNCA30P/p25α with or without co-expression of Rab proteins as indicated using antibodies against α-SNC (BD Transduction Laboratories) and LC3B. C, quantified integrated optical density (IOD) of α-SNC Western blot bands obtained in B are presented as fold increase relative to α-SNCA30P-expressing PC12 cells. Mean ± S.E. of five independent experiments are shown. * denotes a statistic significant increase in IOD when compared with control cells within the respective cell line. D–F, indirect immunofluorescence of PC12-α-SNCA30P/p25α cells co-expressing either HA-Rab1A (D) or HA-Rab8 (E and F). Rab8 was predominantly distributed toward the cell surface and caused a more peripheral distribution of α-SNCA30P (BD Transduction Laboratories) (E) and was co-localized partly with LC3B-positive autophagosomes/amphisomes (F). Bars, 10 μm. G, PC12-α-SNCA30P/p25α cells co-expressing HA-tagged Rab8 were fixed after 2 days of transgene induction and then processed for immunofluorescence to visualize KAI1 (green), α-SNC (red), or F-actin detected with Alexa 633-conjugated phalloidin (blue). Note that Rab8 expression results in accumulation of material on the cell surface, which is immunoreactive with anti-α-SNC and KAI1 antibodies (arrows). The figure is representative of three independent experiments. Bars, 10 μm. H, bar graph shows the percentage of caspase-3-positive PC12 cells of the whole population in indicated cell populations as determined by indirect immunofluorescence and counting. Data represent mean ± S.E. of four independent experiments. I, flow cytometric analysis of PC12 cell populations as indicated stained with PI to measure cell death. The bar graph shows the percentage of PI-positive cells of the total population and represents mean ± S.E. of four independent experiments. H and I, # denotes a statistically significant decrease when compared with control cells within the same cell line.

