FIGURE 6.
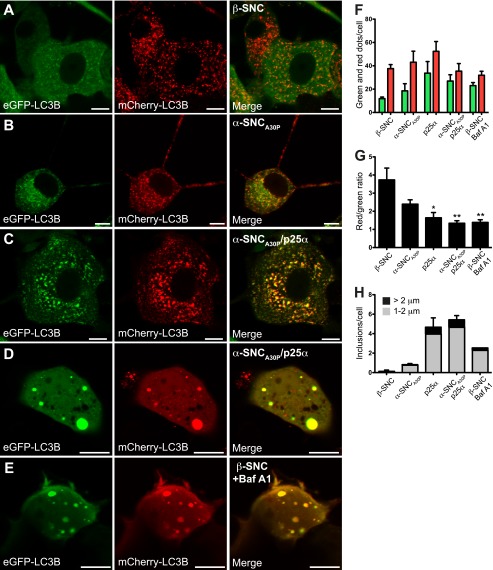
Expression of p25α impairs the autophagosomal flux. A–E, confocal microscopy images of live PC12 cells co-expressing mCherry-eGFP-LC3B with either β-synuclein (β-SNC) (A), α-SNCA30P (B), α-SNCA30P/p25α (C and D), or β-SNC-expressing PC12 (E) cells treated with 20 nm bafilomycin A1 (Baf A1) for 6 h. Bars, 10 μm. F, bar graph shows absolute mean ± S.E. of mCherry (red) and eGFP (green) fluorescent structures per cell profile of three independent experiments. In each experiment 25–30 cells from each cell line were analyzed. G, same data as F presented as the ratio between the absolute numbers of mCherry and eGFP fluorescent dots. H, mCherry- and eGFP-positive structures larger than 1 μm in diameter were quantified according to size (1–2 μm: gray; >2 μm: black). The bar graph shows the number of inclusions per cell and represents mean ± S.E. of three independent experiments.

