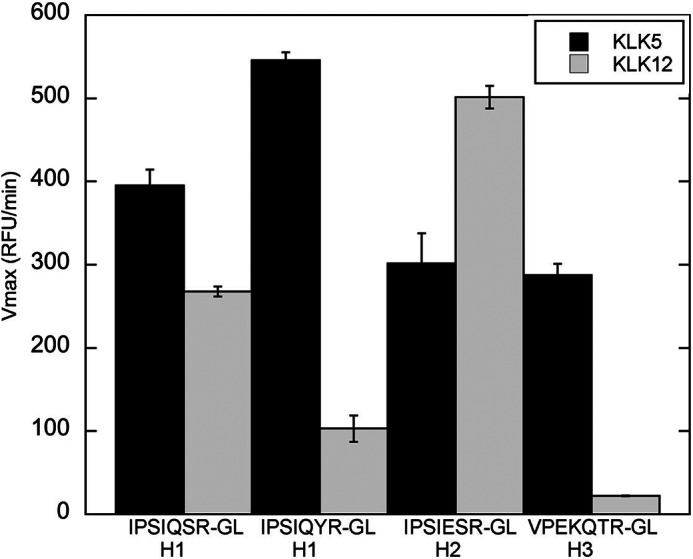
FIGURE 6.

Cleavage of HA cleavage site region peptide mimics by KLK5 and KLK12. The bar graph depicts the cleavage rate of the fluorogenic peptides IPSIQSRGL (H1 consensus), IPSIQYRGL (A/WSN/33 cleavage site), VPQIESRGL (H2 consensus), and VPEKQTRGL (H3 consensus) after treatment with each peptidase. Black bars, KLK5; gray bars, KLK12. The rate of cleavage was determined by monitoring the increase in fluorescence at 390 nm.
