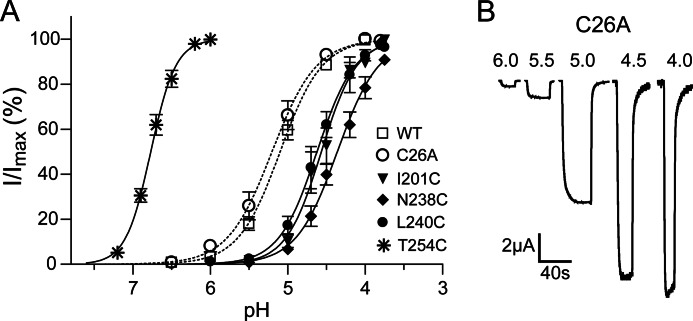
FIGURE 2.
Effects of cysteine mutations on proton induced currents. A, pH-response curves for C26A (dotted line) and mutant GLIC channels are shown. Most mutations shift the pH50 to more acidic pH. T254C shifts the pH50 to a more basic pH. Data are the means ± S.E. from n > 3 experiments. B, shown are representative proton-induced currents from C26A GLIC. pH50 values are reported in Table 1.

