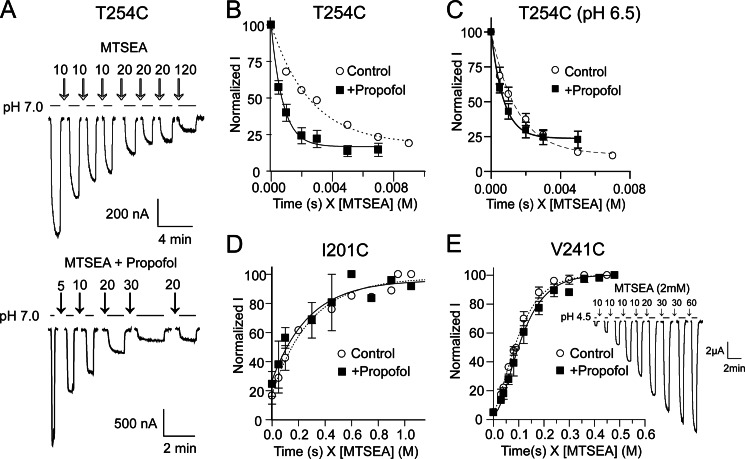
FIGURE 7.
Propofol accelerates modification of T254C and has no effect on I201C and V241C modification A, shown is an example of a rate experiment at T254C where modification by MTSEA inhibits proton-induced currents. pH50 currents were measured before and after successive applications of 100 μm MTSEA (top) or 100 μm MTSEA + 100 μm propofol (below) in pH 7.6 buffer. Duration of MTSEA exposure (s) is indicated on top of the arrows. B, current amplitudes were normalized by the initial current and plotted against cumulative exposure time (s) weighted by concentration of MTSEA (m) and fit to single exponential equations. B–E, shown are rates of MTSEA modification of T254C (B and C), I210C (D), and V241C (E) in the absence (○) or presence (■) of 100 μm propofol. Propofol significantly accelerated modification of T254C when MTSEA was applied at pH7.6 (resting) (B) and pH 6.5 (activated/desensitized) (C). D and E, rates of modification of I201C and V241C were unaltered in the presence of propofol in pH 7.6 buffer. For V241C, the data were best fit with an equation describing two sequential pseudo-first order reactions (see “Materials and Methods”; inset, sample currents from a V241C rate experiment). Data are the mean ± S.E. from ≥3 experiments. Exponential fits of the data are shown as dotted (Control) and solid (+Propofol) lines. Second order rate constants are reported in Table 2.

