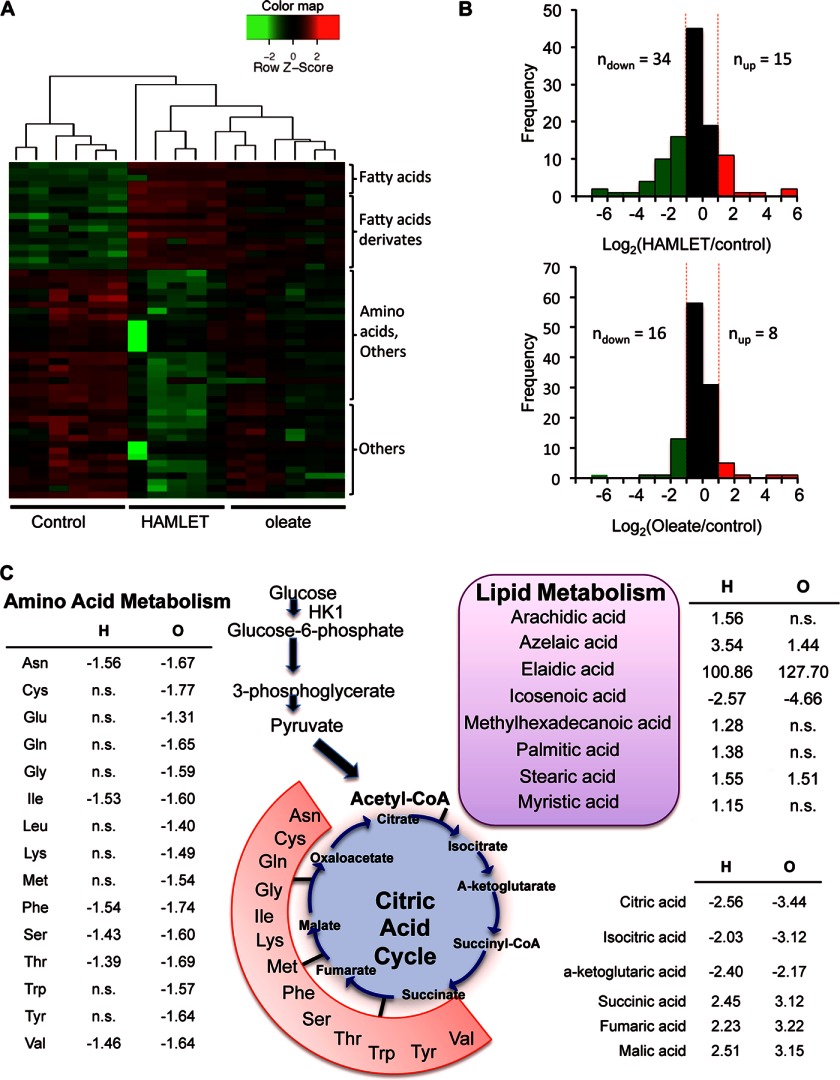
FIGURE 3.
Metabolic responses to HAMLET, oleate, or oleic acid. Metabolites were quantified by GC/MS in extracts of A549 cells treated with HAMLET (35 μm) or oleate (175 μm) for 60 min. A, shown is a heatmap of differentially abundant metabolites. A global decrease in metabolite abundance was detected in the HAMLET samples. B, frequency distribution of log 2-transformed-fold changes in signal intensity between HAMLET-treated and oleate-treated cells is shown. C, targeted metabolite profiling is shown. Change in abundance of lipids, amino acids, and the citric acid cycle metabolites in HAMLET- or oleate-treated cells is shown. n.s., not significant.

