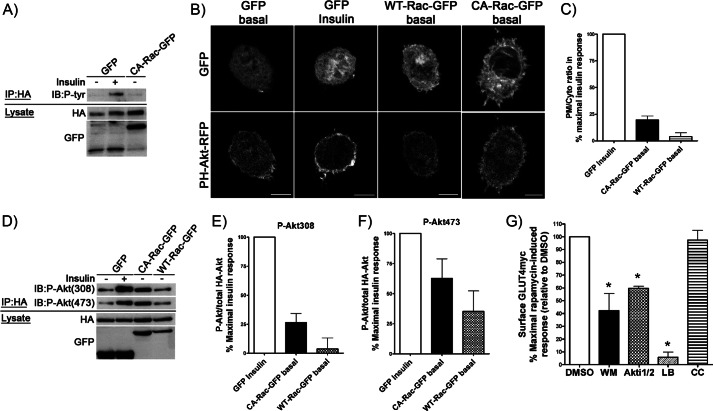
FIGURE 3.
Overexpression of CA-Rac-GFP results in a modest increase in plasma membrane PI(3,4,5)P3 and Akt phosphorylation without engaging IRS-1. A, HA-IRS-1 was co-transfected with GFP or CA-Rac-GFP before stimulating myoblasts with/without insulin for 10 min followed by immunoprecipitation (IP) using anti-HA antibody. Immunoprecipitates were stained with anti-Tyr(P) antibody to detect phosphorylation of IRS-1. B and C, PH-Akt-RFP was co-expressed along with GFP, WT-Rac-GFP, or CA-Rac-GFP. Rounded-up myoblasts were generated and stimulated for 10 min with/without insulin after which the redistribution of the PH-Akt-RFP to the membrane was determined. The plasma membrane to cytosolic (PM/Cyto) ratio of RFP in each condition was quantified and is expressed relative to the percentage of the parallel, maximal insulin response in units normalized to GFP-expressing control cells. D–F, myoblasts expressing HA-Akt + GFP, WT-Rac-GFP, or CA-Rac-GFP were stimulated with/without insulin for 10 min before immunoprecipitation with HA antibody. Immunoprecipitates were analyzed for P-Akt using anti-Thr(P)-308 or -Ser(P)-473 antibodies. Changes in P-Akt/total HA-Akt in each condition were quantified and are presented as the percentage of the parallel, maximal insulin response in units normalized to the GFP-expressing control. G, GLUT4myc myoblasts transfected with Lyn-FRB + YF-CA-Rac were pretreated with DMSO, 100 nm WM, 10 μm Akti1/2, 200 nm LB, or 10 μm compound C (CC) for 20 or 30 min (Akti1/2 and compound C) followed by 10-min rapamycin treatment in the presence of inhibitors. The changes in surface GLUT4myc were quantified and are illustrated as the percentage of the maximal rapamycin-induced response relative to DMSO-treated control cells (mean ± S.E. (error bars); *, p < 0.05 versus DMSO). Representative images of three to four independent experiments are shown. Bar, 10 μm. IB, immunoblot.

